Coloring
- 3 minutes to read
The Bubble Map dashboard item automatically selects palette and scale settings used to color bubbles depending on the provided values.
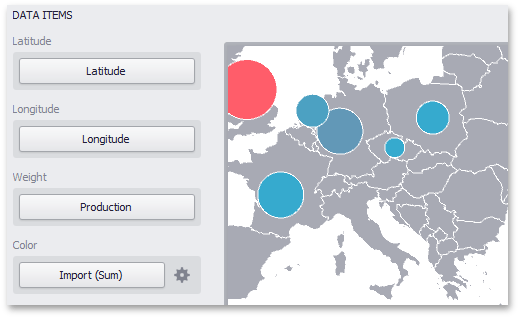
To customize these settings, click the Options button next to the Color placeholder. This invokes the Color Scale Options dialog, which allows you to specify the palette and scale options.
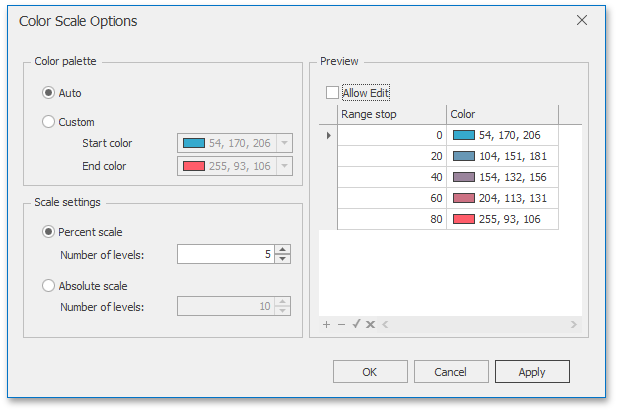
You can specify the following settings in this window.
- Color palette - allows you to specify the start and end color of the palette.
- Scale settings - specifies whether a percent scale or an absolute scale is used to define a set of colors. You can specify the number of levels that represent the number of colors used to color the map.
- Preview is used to display a full set of palette colors generated based on the start/end colors and the number of levels. Use the Allow Edit check box to automatically change the generated colors or specify value ranges for each color.
To specify palette and scale settings in code, use the BubbleMapDashboardItem.ColorPalette and BubbleMapDashboardItem.ColorScale properties, respectively.
Example
The following code snippets show how to bind a Bubble Map dashboard item to data in code and customize the item’s palette.
using System;
using System.Collections.Generic;
using DevExpress.DashboardCommon;
using DevExpress.DataAccess.ConnectionParameters;
using DevExpress.DataAccess.Sql;
using DevExpress.XtraEditors;

namespace Dashboard_CreateBubbleMap {
    public partial class Form1 : XtraForm {
        public Form1() {
            InitializeComponent();
        }

        private void Form1_Load(object sender, EventArgs e) {
            Dashboard dashboard = new Dashboard();
            DashboardSqlDataSource dataSource = new DashboardSqlDataSource();
            dataSource.ConnectionParameters =
                new XmlFileConnectionParameters(@"..\..\Data\DashboardEnergyStatictics.xml");
            SelectQuery sqlQuery = SelectQueryFluentBuilder
                .AddTable("Countries")
                .SelectColumns("Latitude", "Longitude", "Production", "Import", "Country")
                .Build("Countries");

            dataSource.Queries.Add(sqlQuery);
            dashboard.DataSources.Add(dataSource);

            BubbleMapDashboardItem bubbleMap = new BubbleMapDashboardItem();
            bubbleMap.DataSource = dashboard.DataSources[0];
            bubbleMap.DataMember = "Countries";

            bubbleMap.Area = ShapefileArea.Europe;

            bubbleMap.Latitude = new Dimension("Latitude");
            bubbleMap.Longitude = new Dimension("Longitude");

            bubbleMap.Weight = new Measure("Production", SummaryType.Sum);
            bubbleMap.Color = new Measure("Import", SummaryType.Sum);
            bubbleMap.Color.NumericFormat.FormatType = DataItemNumericFormatType.General;

            bubbleMap.TooltipDimensions.Add(new Dimension("Country"));

            CustomizeScale(bubbleMap);
            ShowLegends(bubbleMap);

            dashboard.Items.Add(bubbleMap);
            dashboardViewer1.Dashboard = dashboard;
        }
        private void CustomizeScale(BubbleMapDashboardItem map) {
            CustomScale customScale = new CustomScale();
            List<double> rangeStops = new List<double>();

            customScale.IsPercent = false;

            rangeStops.Add(20);
            rangeStops.Add(200);
            rangeStops.Add(500);
            rangeStops.Add(2000);
            customScale.RangeStops.AddRange(rangeStops);

            map.ColorScale = customScale;
        }
        private void ShowLegends(BubbleMapDashboardItem map) {
            map.Legend.Visible = true;
            map.Legend.Orientation = MapLegendOrientation.Horizontal;
            map.WeightedLegend.Visible = true;
            map.WeightedLegend.Position = MapLegendPosition.BottomLeft;
        }
    }
}