Coloring
In Default color mode, the Pie Map dashboard item colors its segments in the following way:
- If the Pie Map dashboard item contains arguments (the Arguments section), different argument values are colored by hue.
- If the Pie Map dashboard item contains only measures (the Values section), values corresponding to different measures are colored by hue.
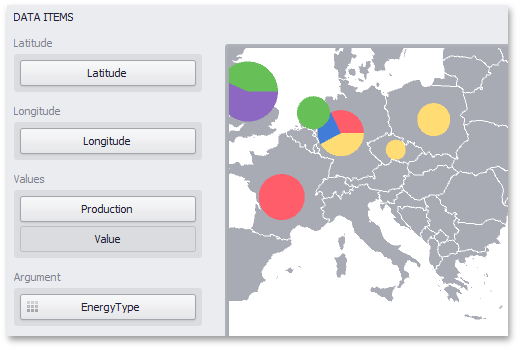
The image below illustrates the Pie Map dashboard item whose argument values are painted in different colors. A special icon ( ) on the data item shows that color variation is enabled.
To access Pie Map color options in code, use the PieMapDashboardItem.ColoringOptions property.