Diagram
- 3 minutes to read
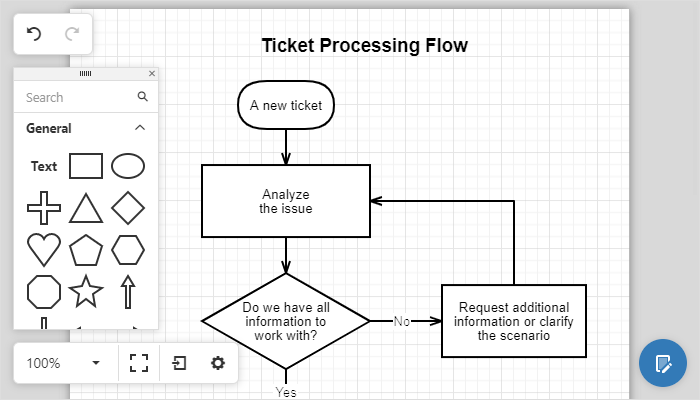
The Diagram control allows you to design diagrams, flowcharts, and org charts online, or display data diagrams without manual drawing. You can also save and load diagrams in the JSON format, or export to image formats.
The Diagram ships with a comprehensive shape library that includes business, technical and multi-purpose diagram shape types. Custom shapes are also supported.
Note
The Diagram is an ASP.NET Core wrapper for the DevExtreme Diagram. For information on how to configure DevExtreme-based ASP.NET Core controls, refer to Razor Syntax.
Bind to Data
See demo: Node and Edge Arrays | See demo: Linear Array | See demo: Hierarchical Array
The Diagram can create diagrams from hierarchical and graph data structures, and automatically arrange this data on the page. You can bind all shape properties to a database, including shape and connector styles, position, and size.
Export to PNG, JPEG, SVG
To export a diagram, call the Export(Action<DiagramExportBuilder>) method. Users can click Export and select the file format to download a diagram in the corresponding image format.
Predefined and Custom Shapes
See demo: Background Images | See demo: Shapes with Base Type
The Diagram ships with more than 40 built-in shapes. Use the CustomShapes(Action<CollectionFactory<DiagramCustomShapeBuilder>>) method to extend the collection of built-in shapes with custom shapes.
You can create a custom shape from scratch and specify its background image, shape size, text, etc. Alternatively, you can create a custom shape based on a default shape type and customize only the required settings, for instance the shape text.
Collapsible Shape Containers
The horizontal and vertical containers allow you to arrange shapes into collapsible groups.
OrgChart Shapes
The Diagram widget provides shapes with images that are specially designed for use in OrgCharts. You can select a shape with the following image positions: on the left, right, or top of the shape.
When the Diagram is bound to a data source, use the ImageUrlExpr(String) method to specify the name of a field that provides a path to images.
Templates
The CustomShapeTemplate(String) method defines a common template for all shapes in the widget. Template content must be presented as SVG elements.
Simple View
Call the SimpleView(Boolean) method with true parameter to enable the Simple view mode. In the Simple view mode, the control does not divide the work area into pages and the diagram occupies all the available area inside the control.
Read Only Mode
Call the ReadOnly(Boolean) method with true parameter to protect the Diagram control from edit operations. In this mode, the control hides its UI elements: toolbox, history toolbar, and properties panel. Use the read only mode to visualize data from a data source or to display an imported diagram.
Diagram Tools
The Diagram widget allows you to customize its UI tools with the following methods.
- ContextMenu(Action<DiagramContextMenuBuilder>)
- ContextToolbox(Action<DiagramContextToolboxBuilder>)
- HistoryToolbar(Action<DiagramHistoryToolbarBuilder>)
- MainToolbar(Action<DiagramMainToolbarBuilder>)
- PropertiesPanel(Action<DiagramPropertiesPanelBuilder>)
- Toolbox(Action<DiagramToolboxBuilder>)
- ViewToolbar(Action<DiagramViewToolbarBuilder>)