The Wizard's Structure: The Construction Page Group
- 4 minutes to read
This document describes the options of the Chart Wizard’s Construction page.
The following is the list of the Wizard’s pages represented in the Construction page group, with a quick overview of each page. Since it’s impossible to detail all the available functionality in one document, for further information on each set of properties, see the corresponding documents referred to in these short descriptions.
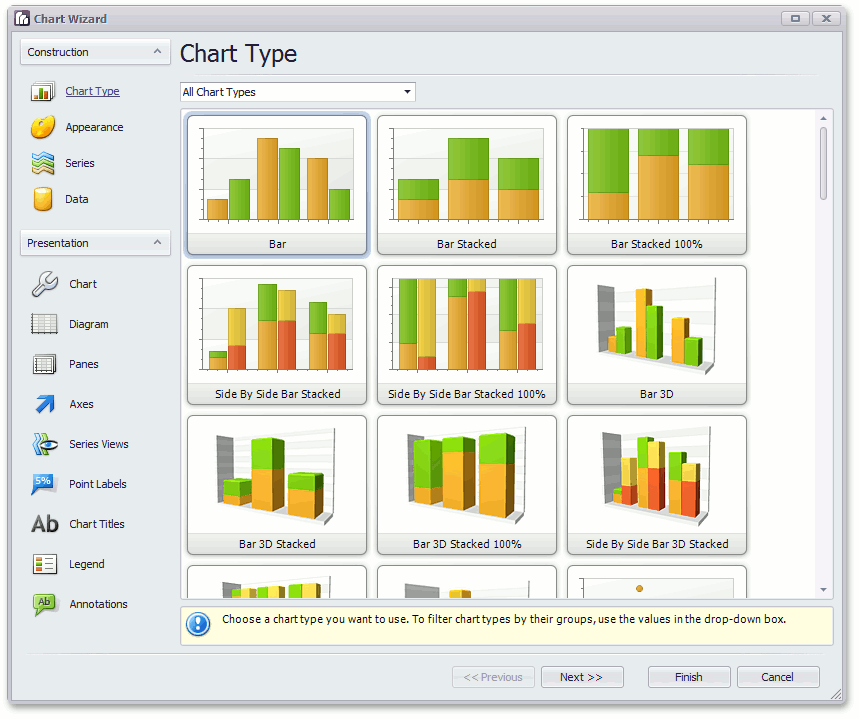
Chart Type
The Wizard’s first page is used to choose the type of chart you want to create.
Note
A chart type defined at this step can be re-adjusted later, in the Series page, by changing the view type of the first visible series in the collection. So, if for example, you need to combine within the same chart multiple series of different view types, simply choose a chart type that is appropriate for your first series.
Appearance
This page is used to define the general appearance for a chart.
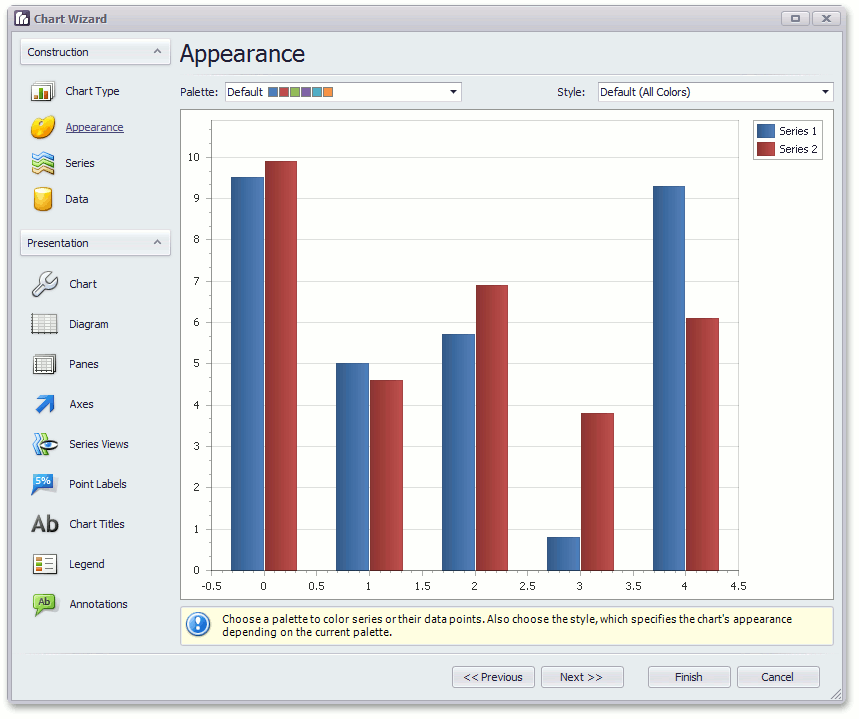
Use the drop-down list at the top, to set a palette for the chart. It determines the overall look of the chart, by painting its key elements. Upon the chosen palette, the chart’s series are painted. And, for each palette, you can also define a derivative style. For more information on this, refer to Appearance Customization.
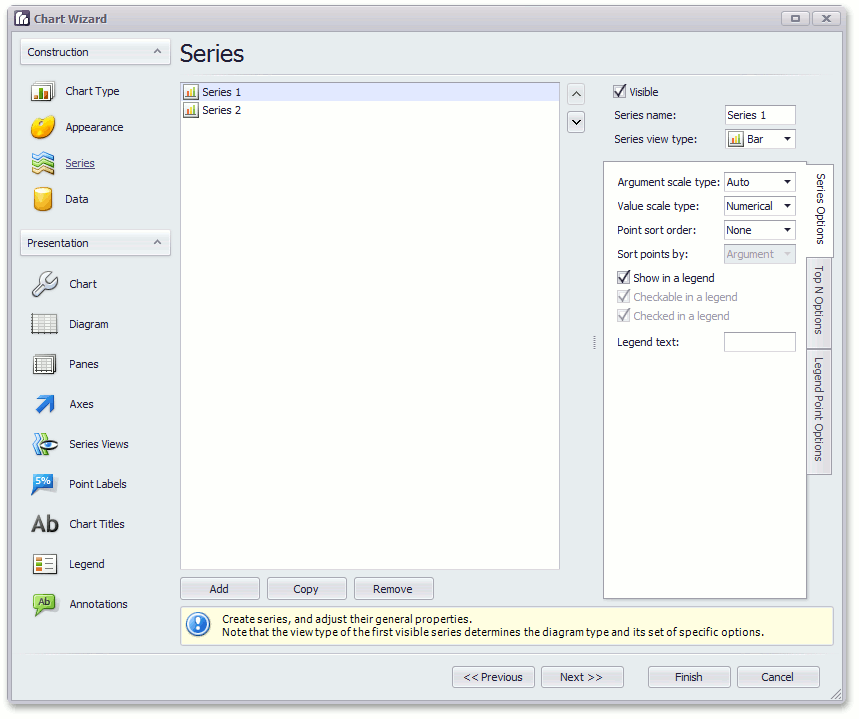
Series
On this page, you can manage the chart’s SeriesCollection, by adding, cloning or removing its series items.
Note
For all your series to be properly displayed, it is critical that their view types are compatible with the first visible series in the collection, which determines your chart’s type.
Furthermore, each series should have an appropriately defined argument and value scale types.
Note
As with view types, use care with series scale types compatibility: argument and values scale types should be identical for all visible series.
So, on this page, for each series you should determine its view type and scale type. And, numerous extra options whose set is determined by the chart type are available on this page. For more information, refer to Manually Add Points to a Series.
Data
This page offers you several ways of populating your chart’s series:
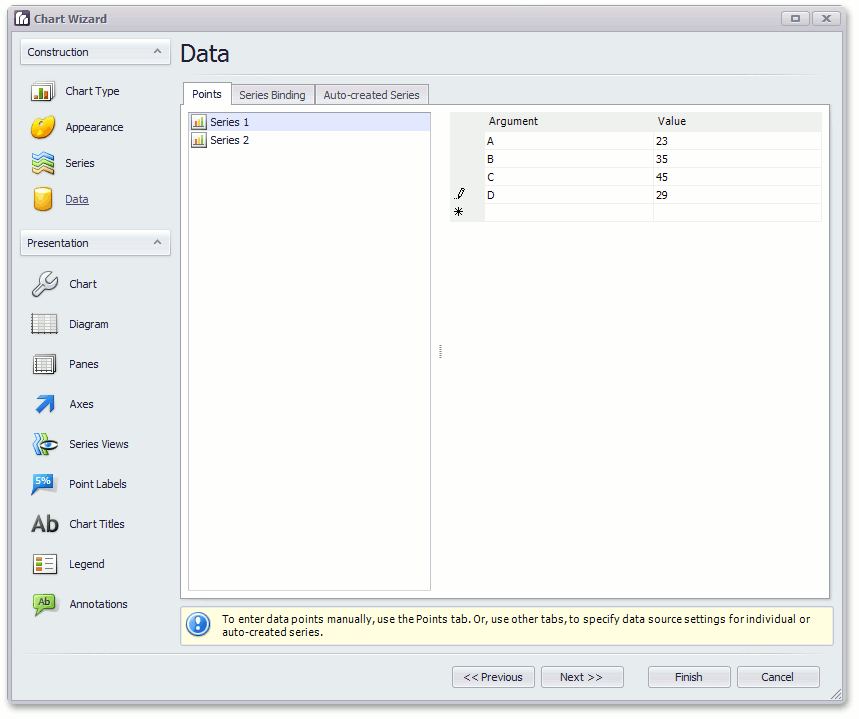
- To manually populate each series with data points, with their arguments and values being specified for each point, use the Points tab.
To individually bind each series to a data source, switch to the Series Binding tab. Here, make sure that a proper data source is selected for a series, and specify data members for series arguments and values, and set the required scale types for them.
After choosing a value data member, you can also select a Summary Function as the binding mode, and specify the required summary function (MIN, MAX, SUM, AVERAGE, or COUNT). After that, an appropriate function will be applied to all the values across the specified data field.
To filter the chart’s data input, click the ellipsis button in the Data filters entry, and in the invoked dialog, construct single or multiple conditions which are to be applied onto a specified data member.
To force series auto-creation, based on a specified template, switch to the Auto-created Series tab.
Here, after making sure that an appropriate data source is used, you should define a data member that is used to generate new series, and common settings which series should use: the view type, name prefix and suffix, argument and value data members and scale types, and so on.
Among other options, here you also can force summary functions to be calculated upon series values, specify series and points sort orders (ascending or descending), choose a criteria upon which points should be sorted (their arguments or values), and place data filters on the incoming data.
To learn more on this, refer to Providing Data and Data Representation.
The Data page ends the Construction page group in the Wizard. This means that after you’ve specified data for your chart, it’s ready to use. The next page group, Presentation, provides the means to customize your chart.