Manually Add Points to a Series
- 2 minutes to read
This document describes how to manually populate a series with data points. This approach is used when the number of points is relatively small. To learn about an alternative approach, refer to the Specify Series Data Members topic.
After you manually create a series, it is not displayed unless it has points.
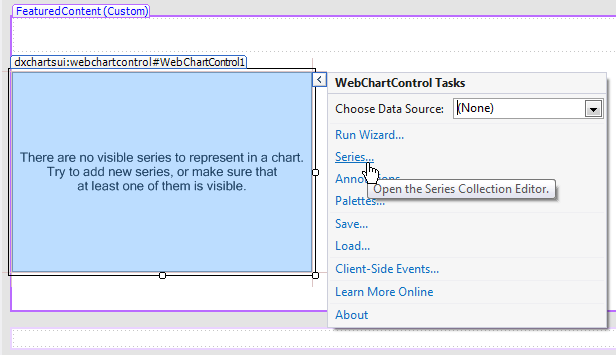
A series points collection is easily managed via the Series Collection Editor, which is invoked by clicking the chart control’s smart tag, and choosing Series… in its actions list.
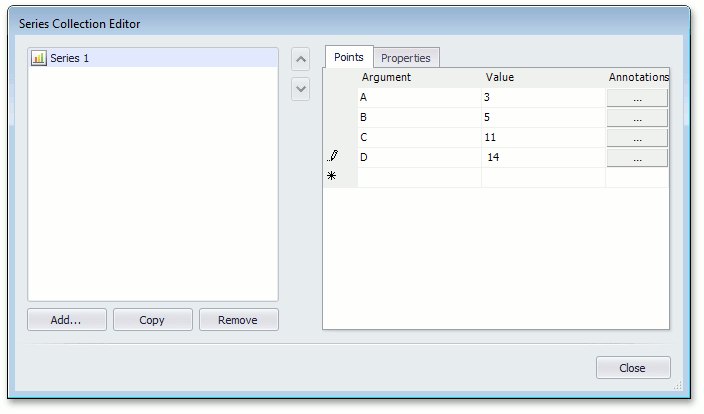
After the dialog is invoked, choose a series on the left side, and in the Points tab, create points by specifying arguments and corresponding values for them. Note that for certain series view types (such as Bubble and Gantt), each point should have more than one value.
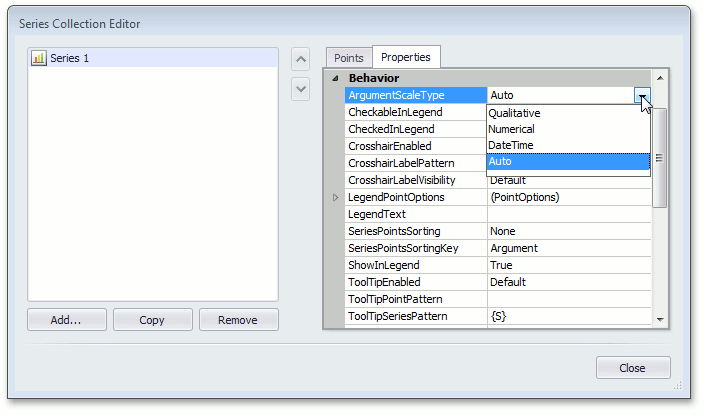
When specifying point arguments and values, you should note the series scale type. By default, the scale type is set to Auto for series arguments, and set to Numerical for values. You do not usually need to change the argument scale type of the SeriesBase.ArgumentScaleType property because the type of series point argument is detected automatically, based on the underlying data type. If you wish to change the value scale type, use the SeriesBase.ValueScaleType property.
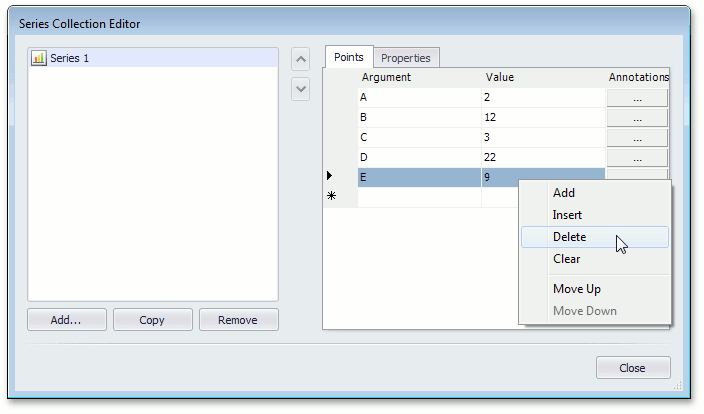
To remove a created point, right-click the point’s row, and in the invoked menu, choose Delete. Points can be reordered in a similar way.
To learn about the most valuable series options, refer to Customize a Series.