Combining Different Series Views
- 3 minutes to read
This document describes limitations that should be taken into account when plotting series of different view types together on the same chart control.
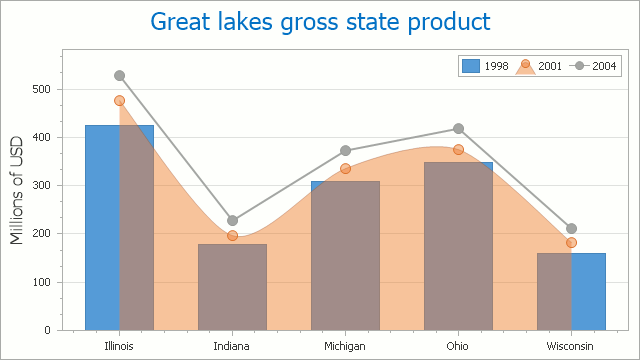
The DevExpress ASP.NET Chart Control allows you to combine series of different view types into a single chart, and display them simultaneously. For instance, you can combine bars and lines together on the same diagram as shown in the images below.
Note
Series of different view types can be plotted within the same diagram, if their view types support the same diagram type.
Furthermore, the type of a chart’s diagram is determined by the view type of the first visible series in the chart’s collection. The Diagram object is equal to null (Nothing in Visual Basic) until the chart has at least one series.
It is not possible to plot 2D and 3D series, or a Pie series and a Bar series, because their diagram types are different - so you can only plot two independent chart controls side-by-side.
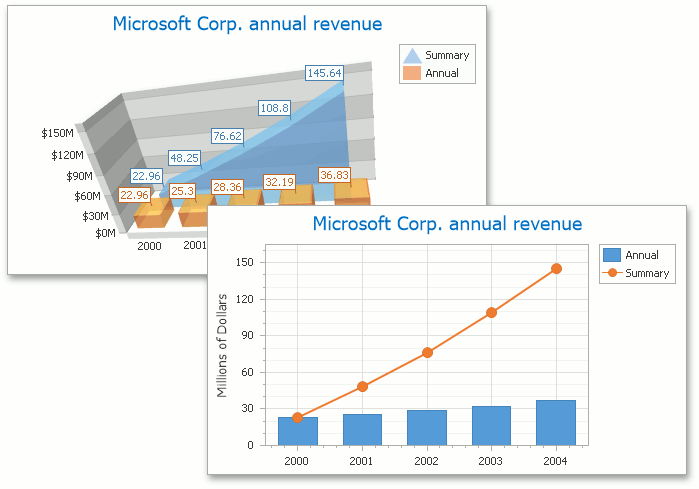
The following image demonstrates two charts with different diagram types (XY-Diagram and XY-Diagram 3D). Each chart contains series of different view types, adapted for the diagram type.
The following table lists the available diagram types, and series view types they support.
For more detailed information on each diagram type, refer to the corresponding document in the Diagram section of the documentation.
Note
Auto-executable sample projects that combine 2D or 3D series view types are available in the DevExpress Code Central database, which you can download from How to combine several charts on a single 2D XY-diagram and How to combine several charts on a single 3D XY-diagram.