Chart Wizard Overview
This document briefly describes how the Chart Wizard can be invoked, and briefly explains its structure.
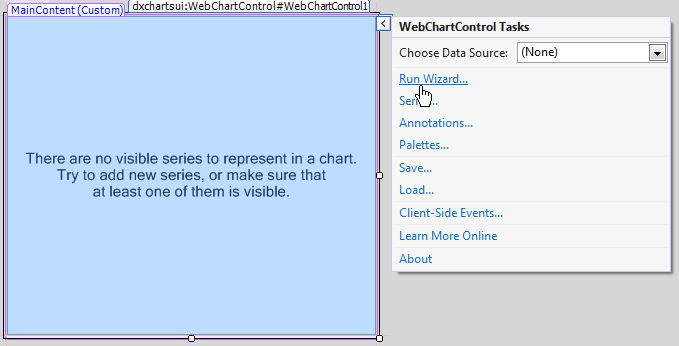
To invoke the Chart Wizard, click the WebChartControl’s smart tag, and choose the Run Wizard… command from its actions list.
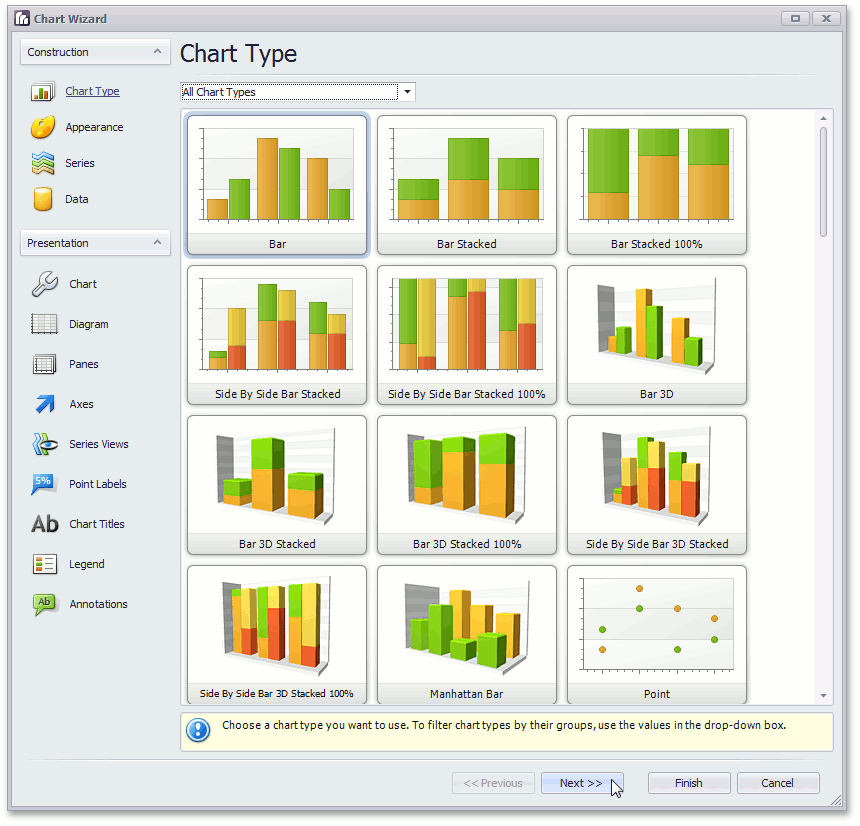
The Wizard is organized in two main areas: the toolbar on the left (which lists pages, that in turn, are organized in two groups: Construction and Presentation), and the main pages area, where all the options are represented by tabs, and where the real-time chart’s preview is situated. And, the panel at the bottom provides quick navigation through the Wizard’s pages.
If your chart is supposed to obtain data from a dataset (the most common case), before you run the Wizard, you should assign that data source’s name to the ASPxDataWebControlBase.DataSource property, to be able to adjust all data-specific settings using the Wizard.
And, with the WebChartControl, you have the freedom to completely customize and localize the Chart Wizard. For more information on this, refer to Chart Wizard.