Regression Lines
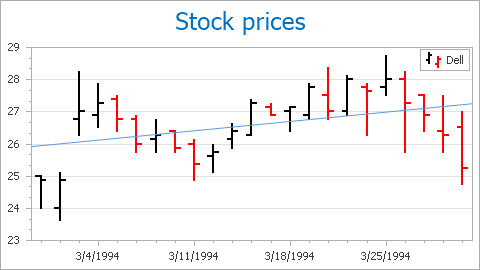
A Regression Line is a series indicator that allows you to perform linear regression analysis over series points.
Along with other indicators, Regression Lines reside in the XYDiagram2DSeriesViewBase.Indicators collection of a series. A series may have any number of Regression Lines. Refer to the following help topic for more information: Regression Lines.
The table below lists the main properties that affect the element’s functionality and appearance.
Class | The RegressionLine class (which is a descendant of the Indicator class) |
Availability | |
Specific Options | |
Appearance | WebChartControl.IndicatorsPaletteName, Indicator.Color and Indicator.LineStyle |
Visibility and Legend Availability | Indicator.Visible, Indicator.ShowInLegend, Indicator.CheckedInLegend |
See Also