Variation Types
- 2 minutes to read
Variation summary display types are designed to display absolute and percentage difference between the current value and the previously calculated value for the field. To employ variation summary display types, use DifferenceBinding in Optimized mode.
The following variation types are available:
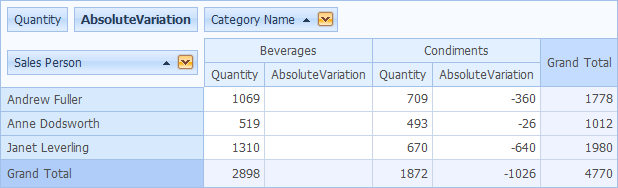
Absolute Variation
The absolute variance between the current value and the previously calculated value for the current field is displayed in a cell.
Example
The following code snippet shows how to calculate the absolute variances for the Pivot Grid cells:
void SetSelectedSummaryDisplayType() {
    if(SummaryDisplayTypeDataField == null)
        return;
    DataSourceColumnBinding sourceBinding = new DataSourceColumnBinding(SourceDataFieldName);
    switch(ddlSummaryDisplayType.SelectedItem.Text) {
        case "AbsoluteVariation":
            SummaryDisplayTypeDataField.DataBinding = new DifferenceBinding(
                sourceBinding,
                CalculationPartitioningCriteria.RowValue,
                CalculationDirection.DownThenAcross,
                DifferenceTarget.Previous,
                DifferenceType.Absolute);
            SummaryDisplayTypeDataField.CellFormat.FormatType = DevExpress.Utils.FormatType.Numeric;
            SummaryDisplayTypeDataField.CellFormat.FormatString = "n0";
            break;
            // ...
    }
    SummaryDisplayTypeDataField.Caption = string.Format("{0}", ddlSummaryDisplayType.SelectedItem.Text);
}
Note
Set PivotGridFieldBase.SummaryDisplayType to AbsoluteVariation in Legacy and LegacyOptimized modes.
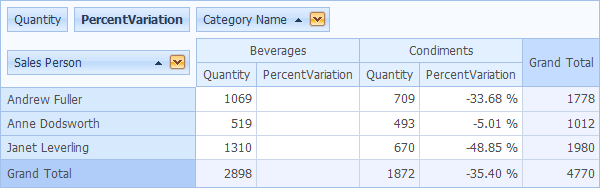
Percent Variation
The percentage variance between the current value and the previously calculated value for the current field is displayed in a cell.
Example
The following code snippet shows how to calculate the percent variances for the Pivot Grid cells:
void SetSelectedSummaryDisplayType() {
    if(SummaryDisplayTypeDataField == null)
        return;
    DataSourceColumnBinding sourceBinding = new DataSourceColumnBinding(SourceDataFieldName);
    switch(ddlSummaryDisplayType.SelectedItem.Text) {
    // ...
        case "PercentVariation":
            SummaryDisplayTypeDataField.DataBinding = new DifferenceBinding(
                sourceBinding,
                CalculationPartitioningCriteria.RowValue,
                CalculationDirection.DownThenAcross,
                DifferenceTarget.Previous,
                DifferenceType.Percentage);
            SummaryDisplayTypeDataField.CellFormat.FormatType = DevExpress.Utils.FormatType.Numeric;
            SummaryDisplayTypeDataField.CellFormat.FormatString = "p2";
            break;
            // ...
    }
    SummaryDisplayTypeDataField.Caption = string.Format("{0}", ddlSummaryDisplayType.SelectedItem.Text);
}
Note
Set PivotGridFieldBase.SummaryDisplayType to PercentVariation in Legacy and LegacyOptimized modes.