KPI Module
- 7 minutes to read
Key Performance Indicators (KPI) are quantitative measurements of dynamic business processes. For instance, an important performance indicator for a trading company might be daily sales, and for a team of developers it might be the number of active bugs in their product. For better visualization, KPI value ranges can be split into a “green zone” (everything is OK), a “yellow zone” (warning), and a “red zone” (things are problematic). When KPI are based on a time range, it can be useful to compare the values of different periods (for instance, the current month versus the previous month). If a deeper analysis (drilldown) is required, then the objects from which an indicator was calculated can be listed. This topic explains the basics of using the KPI module.
Note
ASP.NET Core Blazor applications do not support the KPI Module. Instead, it is possible to use the Dashboards Module or the Chart Module.
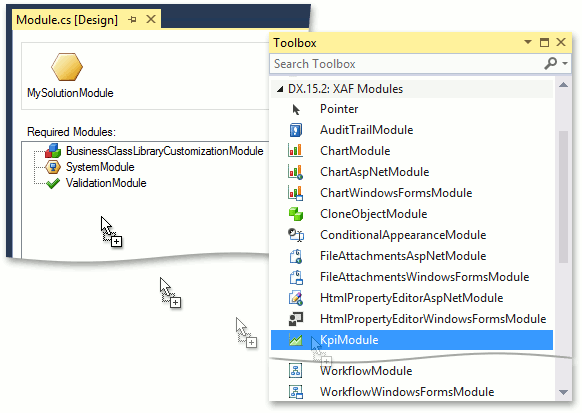
To add the KPI Module (which is platform-agnostic) to the module project, invoke the Module Designer and drag the KpiModule item from the Toolbox to the Required Modules panel. Remember to rebuild your solution after making changes in the Designer.
Note
You can add modules to your application when you use the Template Kit to create a new XAF solution. Select modules in the Additional Modules section.
- To add an extra module in code, add it to the XafApplication.Modules or ModuleBase.RequiredModuleTypes list (adding a reference to the module assembly is insufficient).
In .NET applications, you can call the AddKpi<TBuilder>(IModuleBuilder<TBuilder>, Action<KpiOptions>) method in your WinForms application builder.
When using the KpiModule in a WinForms application, you must also add the ChartWindowsFormsModule to the application using the Application Designer. When using the KpiModule in an ASP.NET Web Forms application, you must add the ChartAspNetModule to the application using the Application Designer.
If you use Entity Framework Code First, perform the following steps to properly register KPI entities in existing project (these steps are not required if you use XPO or if you create a new project in the Template Kit).
Add the following code to the constructor of your platform-agnostic MySolution\Module project.
File: MySolution.Module\Module.cs
DevExpress.ExpressApp.Kpi.KpiModule.UsedExportedTypes = DevExpress.Persistent.Base.UsedExportedTypes.Custom;Ensure that the DevExpress.Persistent.BaseImpl.EFCore.v25.1.dll assembly is referenced and then add KPI Entities from the Business Class Library to the ModuleBase.AdditionalExportedTypes list in the module’s constructor.
AdditionalExportedTypes.Add(typeof(BaseKpiObject));
AdditionalExportedTypes.Add(typeof(KpiDefinition));
AdditionalExportedTypes.Add(typeof(KpiHistoryItem));
AdditionalExportedTypes.Add(typeof(KpiInstance));
AdditionalExportedTypes.Add(typeof(KpiScorecard));
Register these entities (except for the abstract BaseKpiObject) in your DbContext.
public DbSet<KpiDefinition> KpiDefinition { get; set; }
public DbSet<KpiInstance> KpiInstance { get; set; }
public DbSet<KpiHistoryItem> KpiHistoryItem { get; set; }
public DbSet<KpiScorecard> KpiScorecard { get; set; }
Note
Avoid the simultaneous use of DevExpress.Persistent.BaseImpl.EF.Kpi and DevExpress.ExpressApp.Kpi namespaces in the using directives of your code. Otherwise, a class name conflict will occur. Use fully qualified type names instead.
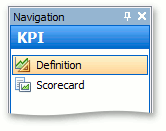
When the KPI module is used in an XAF application, the KPI navigation group with the Definition and Scorecard navigation items is available.
In the Definition tab, a new KPI definition represented by the KpiDefinition persistent object can be created.
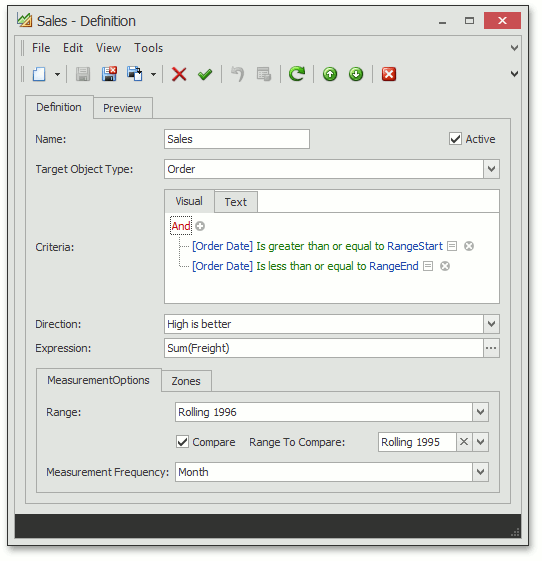
The KpiDefinition object properties are described in the table below.
Property | Description |
|---|---|
Name | KPI name. |
TargetObjectType | The type of business object the KPI is designed for. |
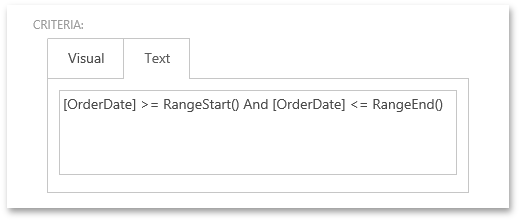
Criteria | Specifies the Criteria Language expression that is used to calculate each measurement item based on the MeasurementFrequency property. The CurrentValue of the entire KPI instance represents the last measurement value. In the expression, you can use the RangeStart() and RangeEnd() Function Criteria Operators that internally get replaced with the actual date range start and end values calculated from the
|
Direction | The Direction { LowIsBetter, HighIsBetter } enumeration value specifies how to treat deviation from a previous measurement result. |
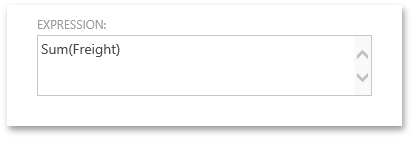
Expression | An expression that is used to evaluate KPI - Sum, Count, Avg, etc. In WinForms applications, you can use the PopupExpressionPropertyEditor Property Editor to simplify the creation of an expression of any complexity with the help of the Expression Editor dialog. To achieve this, invoke the Model Editor and set the PropertyEditor property of the BOModel | KpiDefinition | OwnMembers | Expression node to DevExpress.ExpresssApp.Win.Editors.PopupExpressionPropertyEditor. In an ASP.NET Web Forms application, there is no special editor for an expression, so it is edited as a string.
You can use ?RangeStart and ?RangeEnd parameters to create free joins:
The expression above evaluates the percentage ratio of orders in the RangeStart/RangeEnd period and the total number of orders. The KPI module replaces these predefined strings with values when it evaluates the expression. The strings are not used outside the KPI module. |
Range | The period to analyze. |
Compare | The Boolean flag that indicates if current KPI values should be compared to previous values calculated using the RangeToCompare period. |
RangeToCompare | The past period to be compared with the Range. |
MeasurementFrequency | The Range is split into intervals, and the MeasurementFrequency specifies the size of each interval. For each interval, a KPI value is calculated. |
GreenZone, RedZone | Specify the KPI value’s “green” and “red” ranges, which can be used for visualization. You can define Conditional Appearance rules that take these values into account. |
SuppressedSeries | Specifies the range whose sparkline is suppressed in the Dashboard. The SuppressedSeries editor is invisible by default. More details on this property are provided below. |
In a Preview tab, the current KPI value and the collection of objects used to calculate KPI are available.
Note
Set the IModelListView.DataAccessMode option to Client for the nested List View displayed in the Preview tab - the KPI Module does not support other modes. The Objects collection displayed in this List View is not associated with the KpiDefinition object. It is created and filtered by the Objects property getter. A Criteria applied to this collection will be ignored in Server, ServerView, InstantFeedback, InstantFeedbackView, and DataView modes.
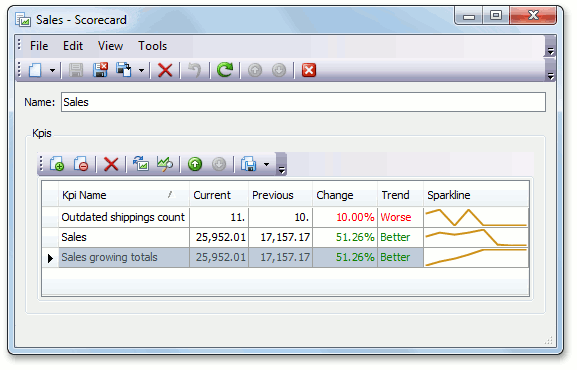
To view and analyze the collection of KPI, the Scorecard object can be used. Scorecard is an object that has linked KPI. Under the Scorecard navigation item, Scorecards with linked KPI can be created.
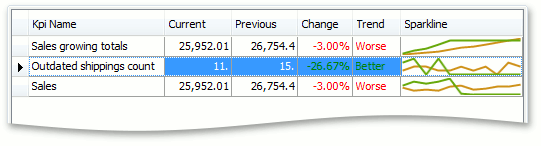
The changes for the current period are visualized in the Sparkline column by default. To display current and previous periods, set the KpiDefinition object’s Suppressed Series property to an empty string (its value is “Previous” by default). This property is invisible in the KPIDefinition object’s Detail View layout by default. To allow end-users to change the Suppressed Series value at run-time, modify the Detail View layout to make the Supressed Series editor visible (see Display a Nested Property Editor in a Detail View and Detail View Layout Customization for details). The image below illustrates the Sparkline column, displaying both previous and current value changes.
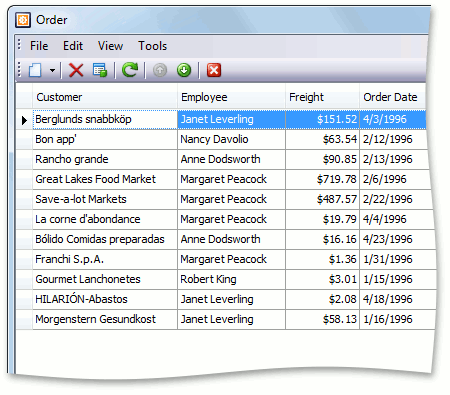
A drill-down list view can be invoked by double-clicking the KPI. The result is a list of objects that were used to calculate the KPI. This list view can be analyzed by grouping and sorting data.
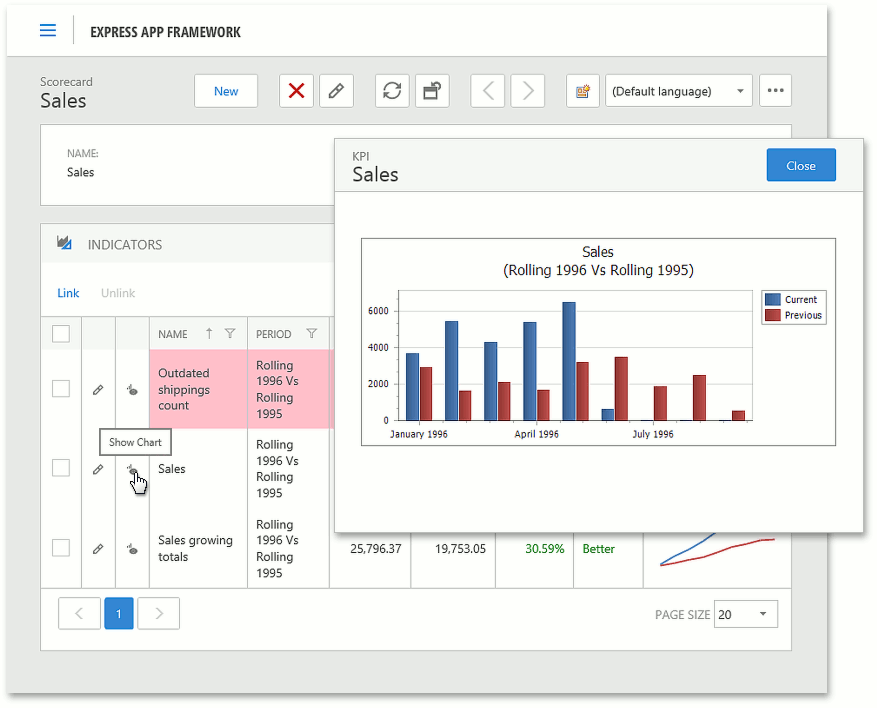
To visualize KPI on the scorecard or dashboard, the KpiInstance objects are used. The KpiInstance is separated from the KpiDefinition. The KpiInstance object holds and manages KPI measurement history, retrieves Current and Previous values from the KPI history cache, creates a data source for sparkline and chart editors, and is responsible for cleaning outdated values from the cache. A KpiInstance object is created by a KpiDefinition object in its AfterConstruction method. The ShowChart Action provides the capability to view KPI results as a chart.
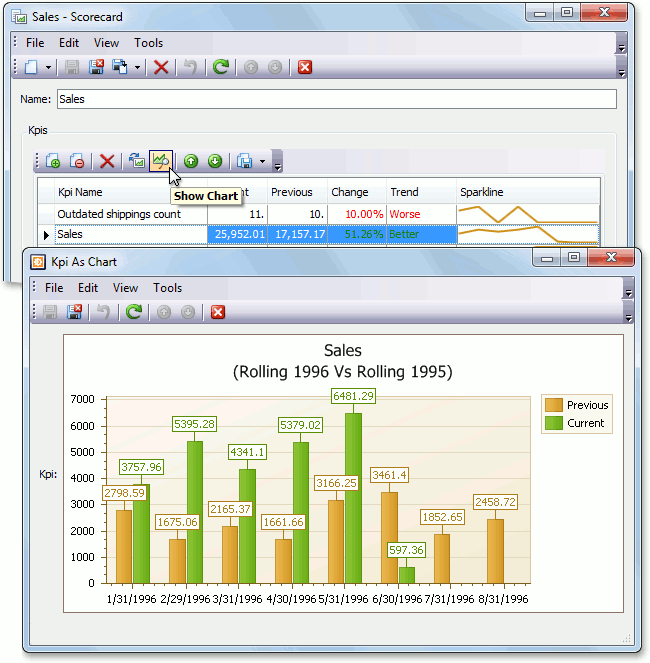
Although only the WinForms application screenshots were illustrated, the same functionality is available in an ASP.NET Web Forms application.
The chart is customizable in the Chart Designer, and can be printed just like charts created with the Pivot Chart Module.
Note
To see how the KPI values are calculated internally, check the actual SQL queries using one of the following approaches:
- in the XPO log (see How to log the SQL queries made by XPO);
- using the XPO Profiler tool;
- using the SQL Server Profiler tool (to profile incoming queries on the SQL Server side).
An example of KPI module usage is provided in the Feature Center demo that ships with XAF. The default location of the application is %PUBLIC%\Documents\DevExpress Demos 25.1\Components\XAF\FeatureCenter.NETFramework.XPO.