Create a Hierarchical Report in the Visual Studio Report Designer
- 6 minutes to read
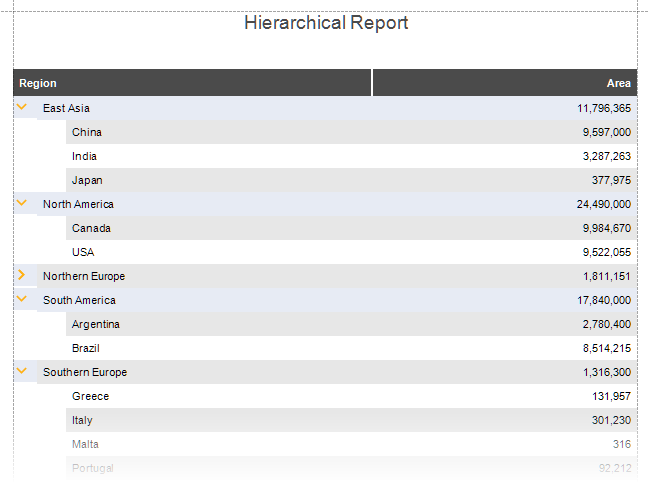
This topic describes how to use the HierarchyPrintOptions property to create a hierarchical (tree-like) report with nodes that expand or collapse on click.
- View Online Demo.
- View Desktop Demo (requires the DevExpress Demo Center installation).
Demo Data
The following code defines the CountryData class (which is a data record), and the CountryDataSource class (which is a list of data records). Each record has a ParentRegionID field, which defines the parent-child relationship used to build the hierarchy.
Add the following files to your project:
public class CountryData {
    public CountryData(int regionId, int parentRegionId, string region, double area) {
        RegionID = regionId;
        ParentRegionID = parentRegionId;
        Region = region;
        Area = area;
    }
    public int RegionID { get; set; }
    public int ParentRegionID { get; set; }
    public string Region { get; set; }
    public double Area { get; set; }
}
using System.Collections.Generic;
// ...
    public class CountryDataSource : List<CountryData> {
        public CountryDataSource() {
            List<CountryData> sales = new List<CountryData>() {
                new CountryData(0, -1, "Northern Europe", 1811151),
                new CountryData(1, 0, "Norway", 385207),
                new CountryData(2, 0, "Sweden", 528447),
                new CountryData(3, 0, "Denmark", 42951),
                new CountryData(4, 0, "Finland", 338455),
                new CountryData(5, 0, "Iceland", 103000),
                new CountryData(6, 0, "Ireland", 84421),
                new CountryData(7, 0, "United Kingdom", 243610),

                new CountryData(17, -1, "Southern Europe", 1316300),
                new CountryData(18, 17, "Spain", 505990),
                new CountryData(19, 17, "Portugal", 92212),
                new CountryData(20, 17, "Greece", 131957),
                new CountryData(21, 17, "Italy", 301230),
                new CountryData(22, 17, "Malta", 316),
                new CountryData(23, 17, "San Marino", 61.2),
                new CountryData(25, 17, "Serbia", 88499),

                new CountryData(26, -1, "North America", 24490000),
                new CountryData(27, 26, "USA", 9522055),
                new CountryData(28, 26, "Canada", 9984670),

                new CountryData(29, -1, "South America", 17840000),
                new CountryData(30, 29, "Argentina", 2780400),
                new CountryData(31, 29, "Brazil", 8514215),

                new CountryData(32, -1, "East Asia", 11796365),
                new CountryData(34, 32, "India", 3287263),
                new CountryData(35, 32, "Japan", 377975),
                new CountryData(36, 32, "China", 9597000)
            };
            this.AddRange(sales);
        }
    }
After you add the data source to the project, rebuild the project.
Create a Report
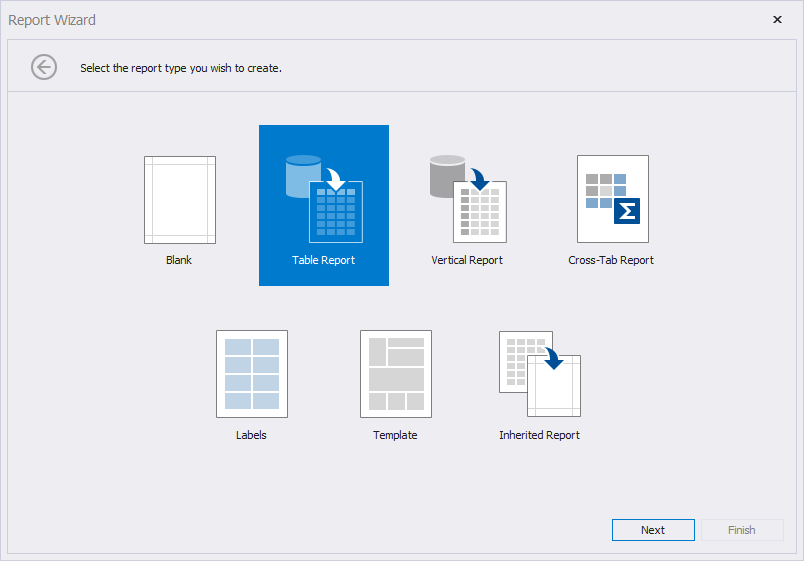
Invoke the Report Wizard, as described in the following help topic: Report Wizard- Use the Item Templates.
Select Table Report and click Next.
(2.1-2.6) Create an ObjectDataSource based on the CountryDataSource class that you added before. For more information on how to bind a report to an object data source, review the following help topic: Business Object.
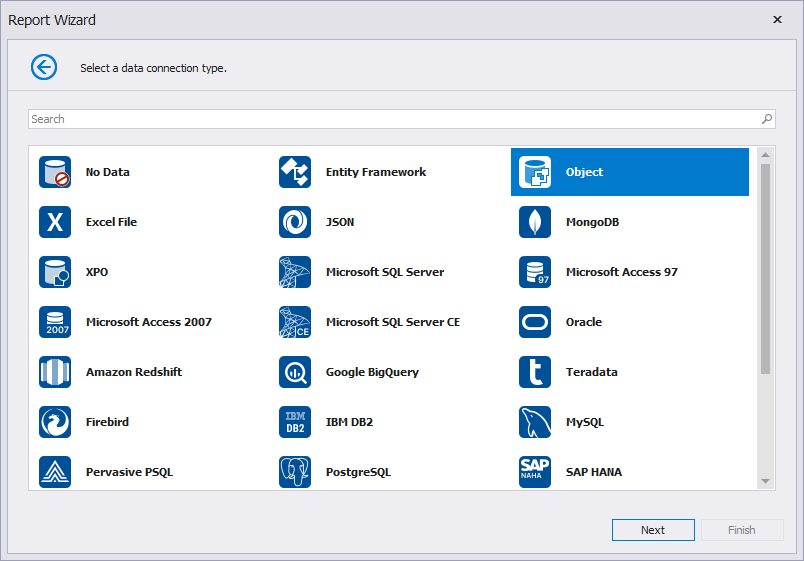
Select the data source type
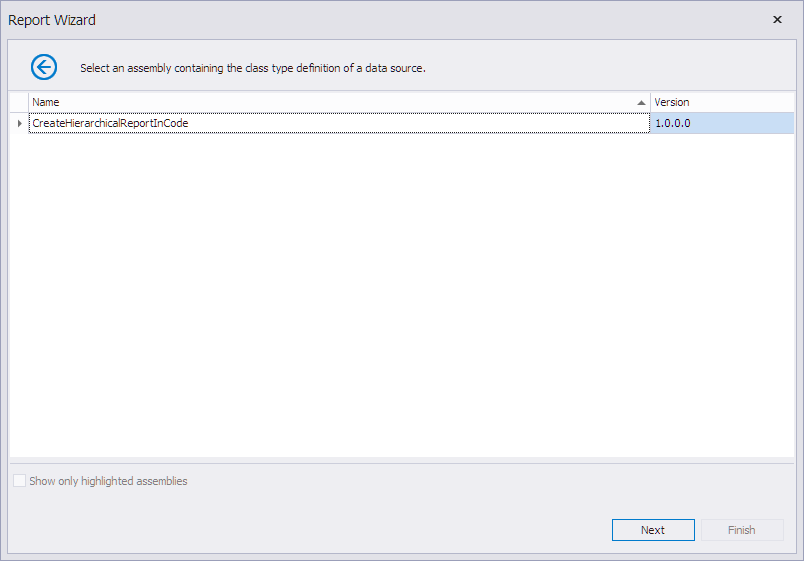
Select the assembly that contains the class type to bind
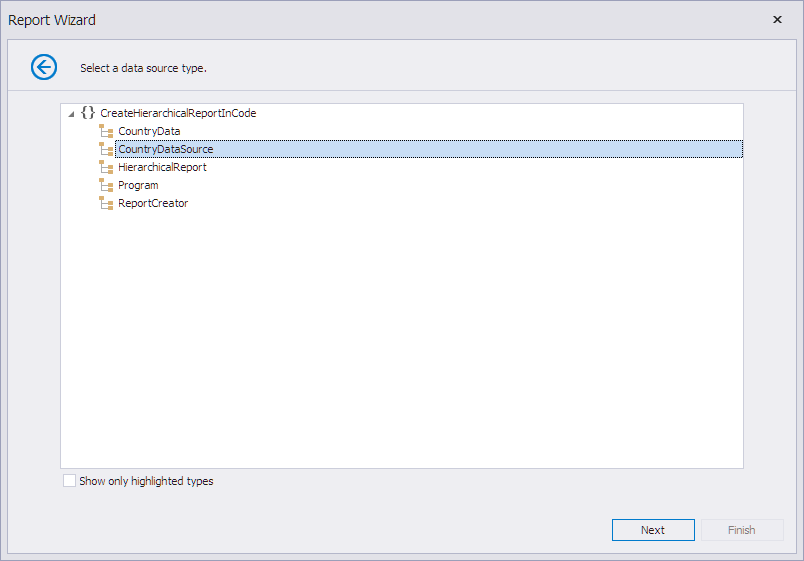
Select the class type to bind
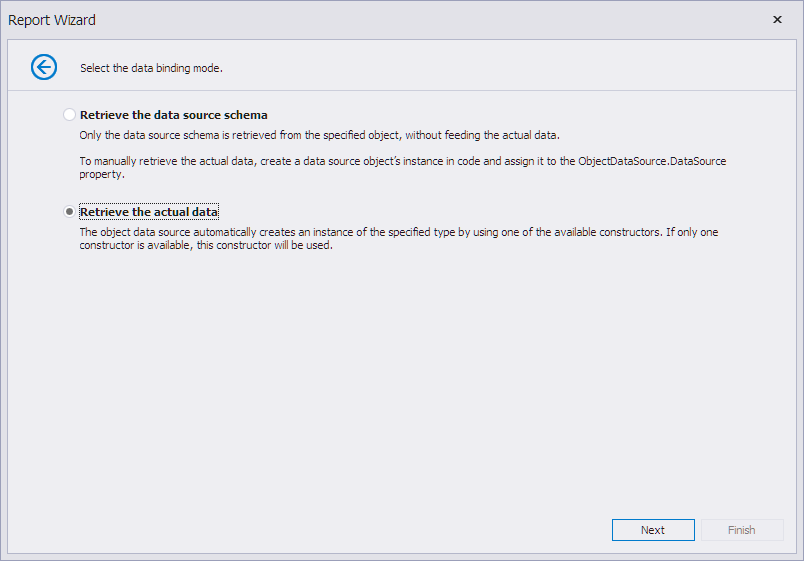
Select whether to retrieve the data
Select the
RegionandAreadata fields to create a table report bound to the data source.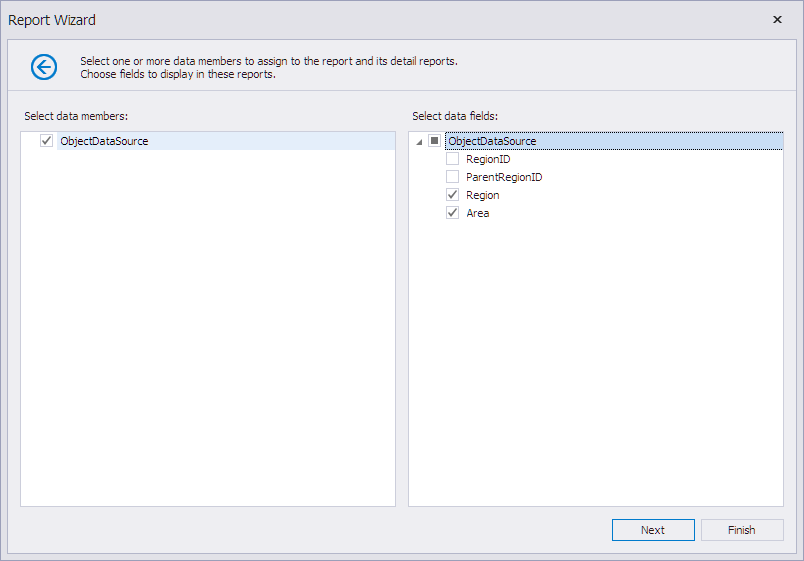
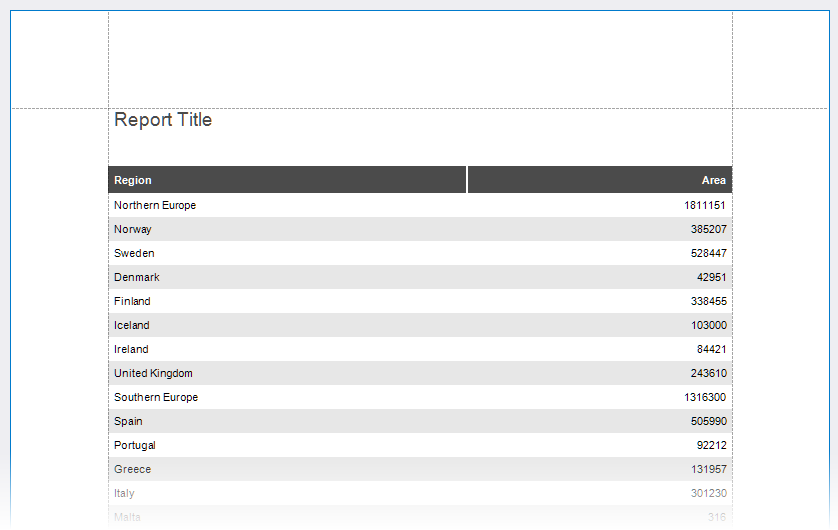
Click Finish. The Report Designer opens the generated report.
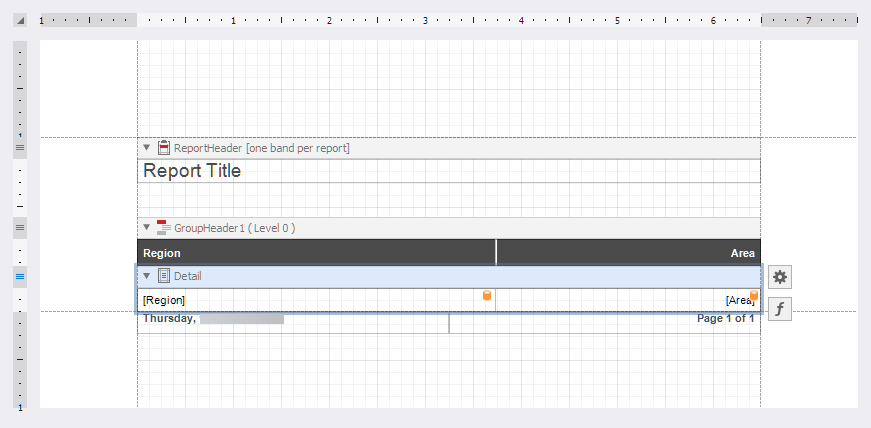
Switch to the Preview tab to see an intermediate result.
Note
If a report contains grouped data, the HierarchyPrintOptions property is not in effect, and you cannot use it to create a hierarchical report. You can implement the desired report layout with a hierarchical report that is loaded in the XRSubreport control and uses parameter bindings.
Specify Hierarchy Print Options
Do the following to print the report’s hierarchical data in tree mode:
Specify the Detail band’s HierarchyPrintOptions property. Set the KeyFieldName property to the
RegionIDfield, and the ParentFieldName to theParentRegionIDfield. Specify the child level node offset with the Indent property.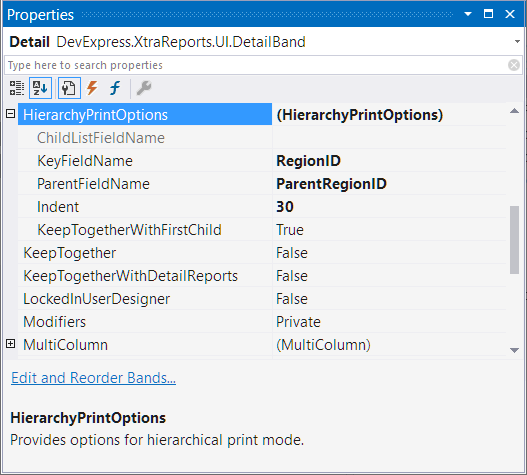
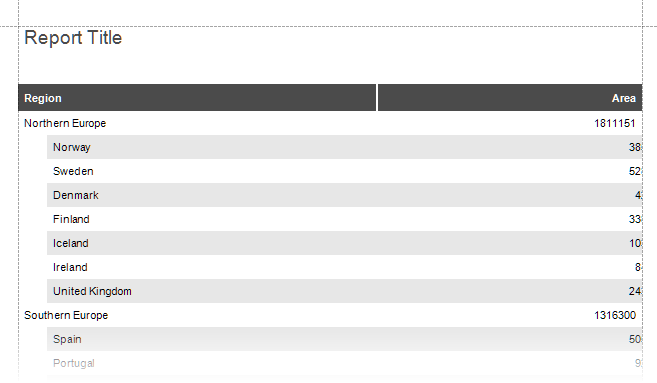
As you can see in the image above, the Detail band that contains child rows is printed with the specified indent. However, the row (the sum of the cell widths) does not fit the page.
The band content is shifted by a certain offset value. To keep the content within the right margin, you must enable anchoring.
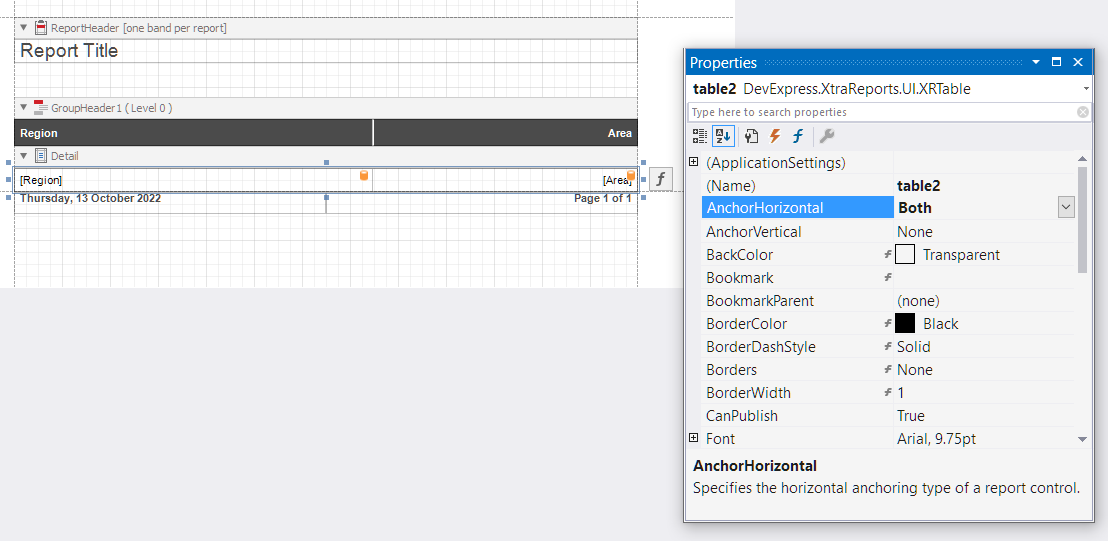
Anchor the cell labels to the edges of the Detail band. For this, set the label’s AnchorHorizontal property to Both:
Switch to Preview to see the result:
Add a Drill-Down Control
Add the XRCheckBox control to the Detail band at the leftmost position, and clear its
Textproperty.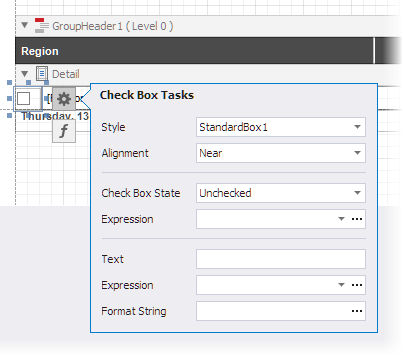
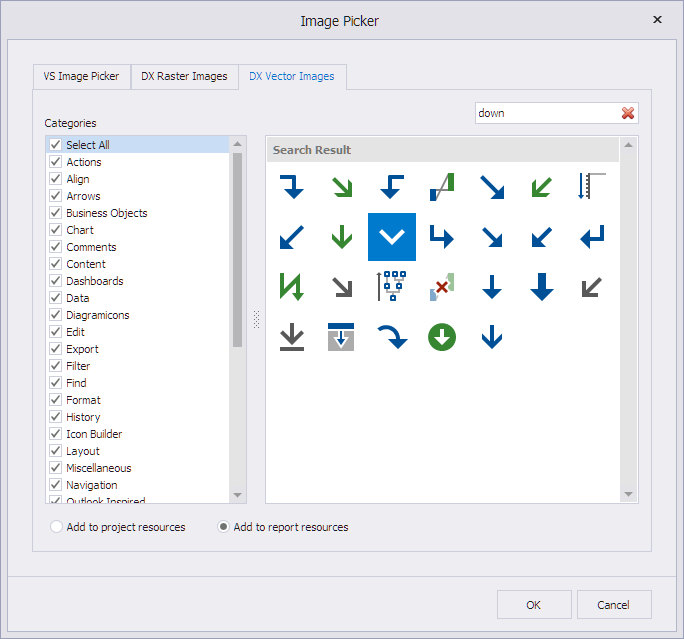
Set the XRCheckBox control’s glyph options. You can use custom glyphs for the checked and unchecked checkbox states. This example uses images from the DX Vector Images collection. This collection is available in the Image Picker that is invoked when you click the ellipsis button next to the CustomGlyphs.Checked or CustomGlyphs.Unchecked property in the Properties window:
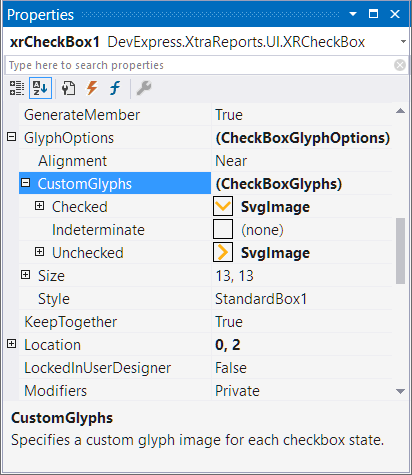
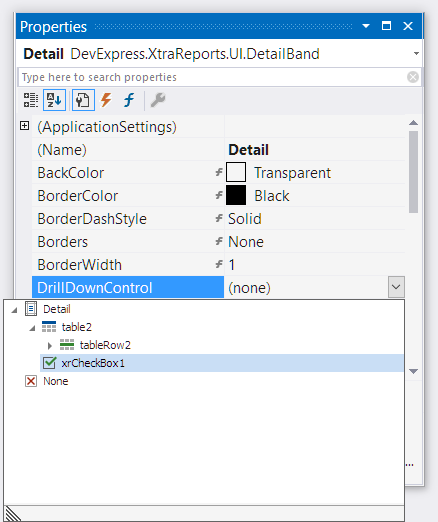
When glyphs are set, the Properties window appears as follows:
Specify the xrCheckBox1 control as the control that expands and collapses the node on click. For this, set the Detail band’s DrillDownControl property to the newly added xrCheckBox1 control:
Add an expression that changes the CheckBoxState property depending on whether the node is expanded. Use the following expression:
[ReportItems].[Detail].[DrillDownExpanded]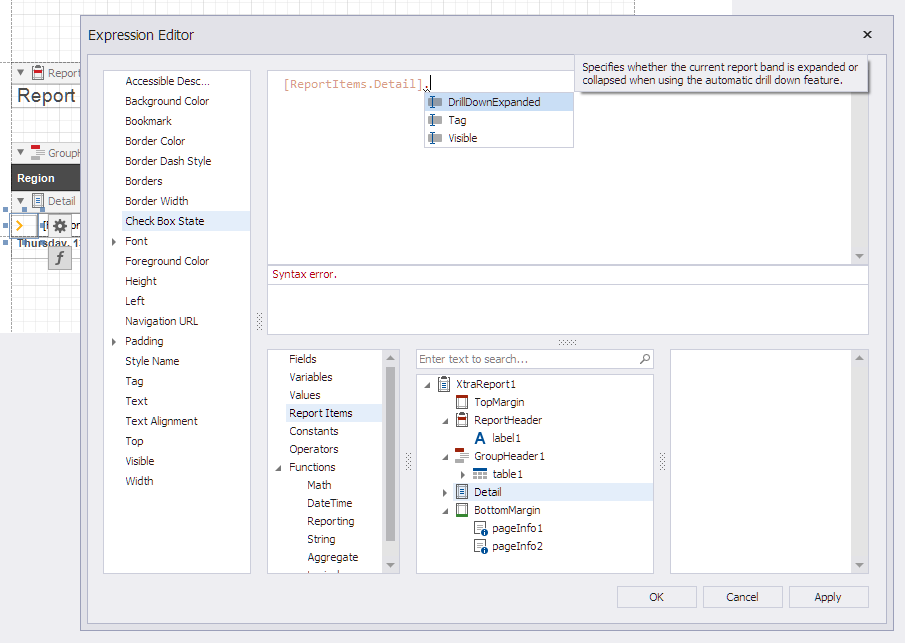
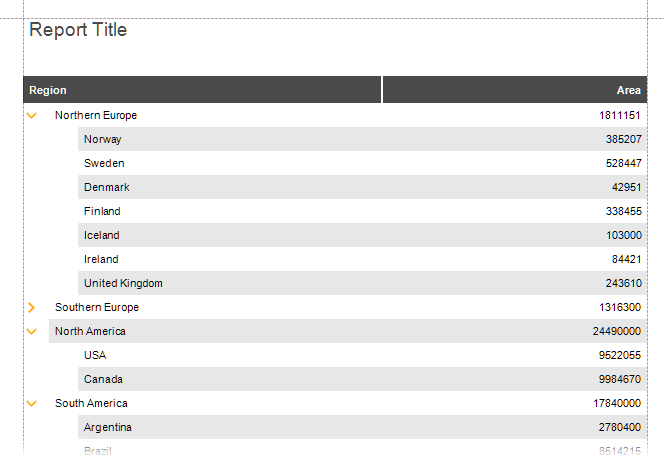
Switch to Preview to see the result:
Sort and Format Data
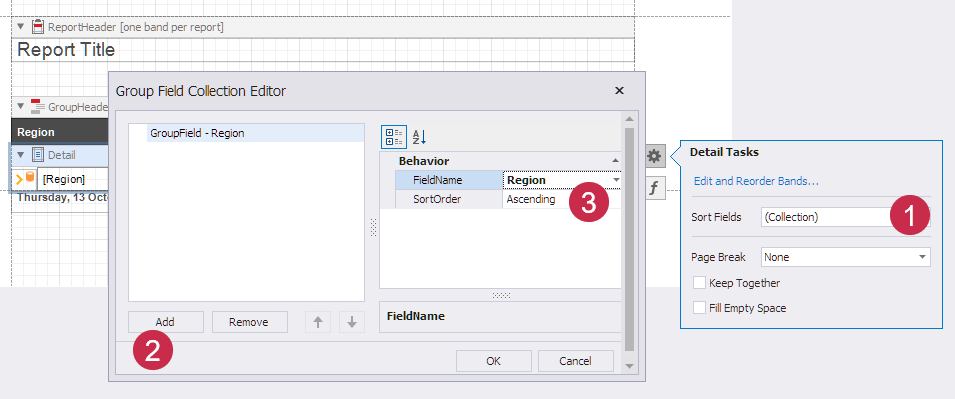
Use the SortFields property to sort data rows on each hierarchy level:
Specify the
{0:N0}format string to display area values: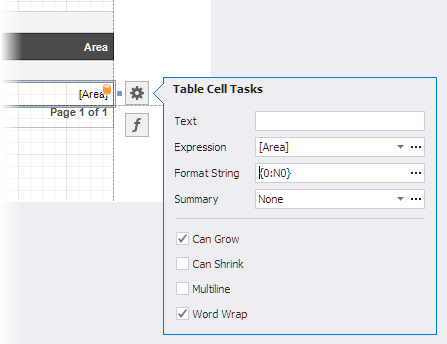
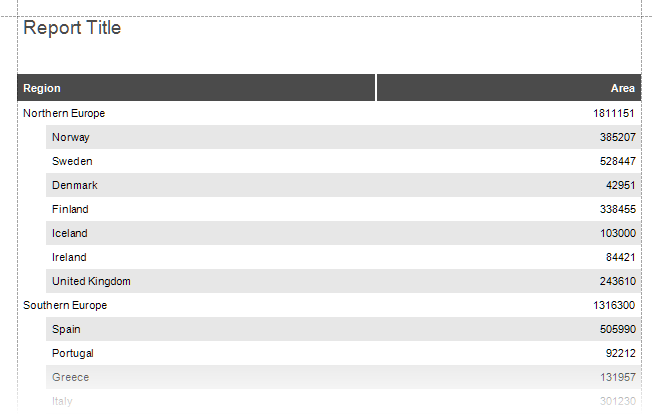
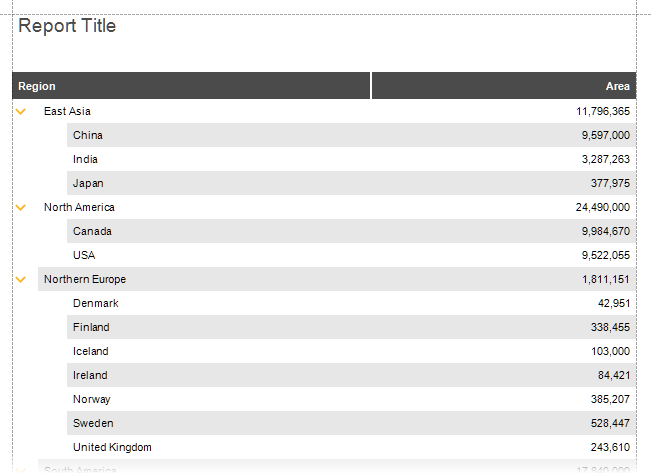
Switch to Preview to see the result:
Highlight Root Nodes
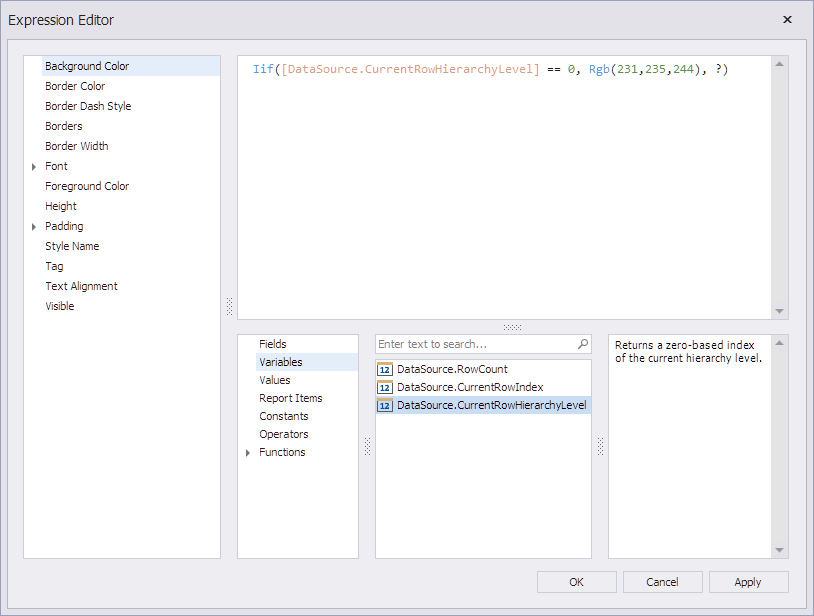
To change the appearance of rows based on their nesting level, use the CurrentRowHierarchyLevel variable in expressions. Specify the background color of the top level rows with the following expression:
iif([DataSource.CurrentRowHierarchyLevel] == 0, Rgb(231,235,244), ?)
Assign this expression to the Detail band’s BackColor property:
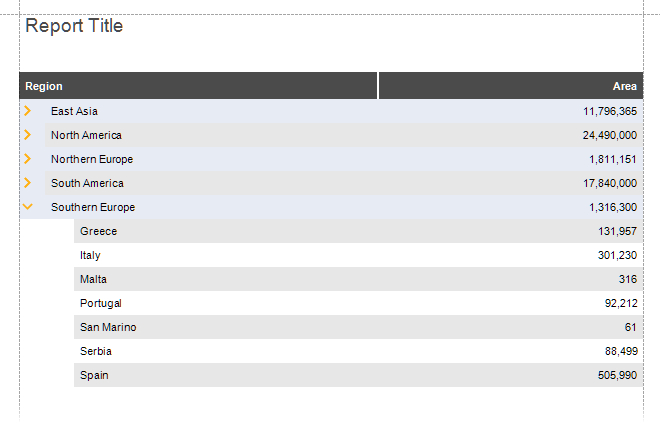
Switch to Preview to see the result:
The report created as a result of the steps in this topic is available in the example project:
Create a Hierarchical Report in the End-User Report Designer
Tutorials that explain how to create different reports in EUD Report Designers for WinForms and Web are included in the End-User Documentation online help section:
- Create a Hierarchical Report in the End-User Report Designer for Web
- Create a Hierarchical Report in the End-User Report Designer for WinForms
Create a Hierarchical Report based on Data Stored in a Flat Table
You can create a hierarchical tree-like report based on data stored in a flat table. Data must meet certain requirements–two additional fields are necessary to build a tree structure:
- The first field must contain unique values.
- The second field must contain values that indicate parent nodes for the current node.
See the following example for more information: