Lesson 1 - Add a Report and Bind It to Data
- 2 minutes to read
This lesson describes how to create a new report and bind it to a database. The lesson also shows how to specify a master-detail relationship between database queries.
Open an existing application or create a new application.
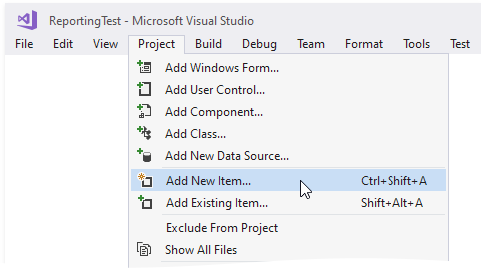
Select PROJECT | Add New Item… in the Visual Studio main menu or press CTRL+SHIFT+A.
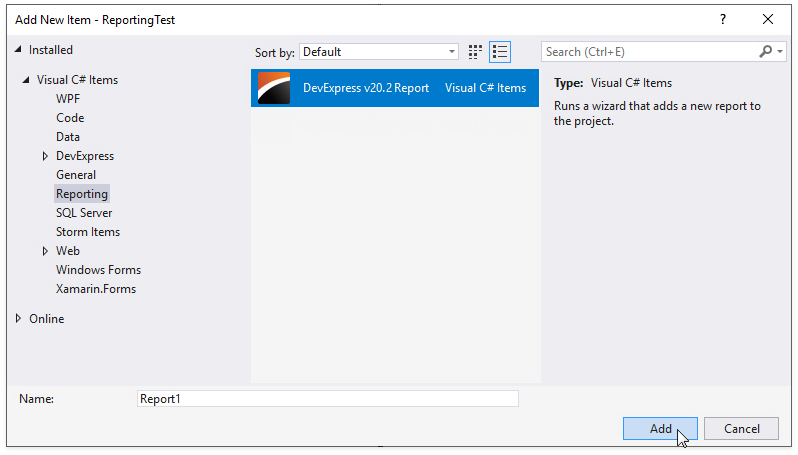
In the Add New Item dialog, select the DevExpress v20.2 Report item and click Add.
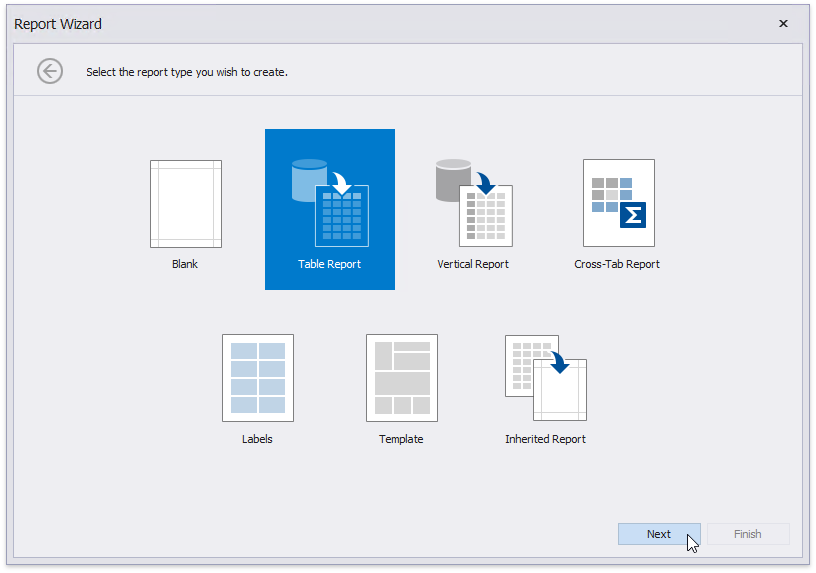
In the invoked Report Wizard, select Table Report and click Next.
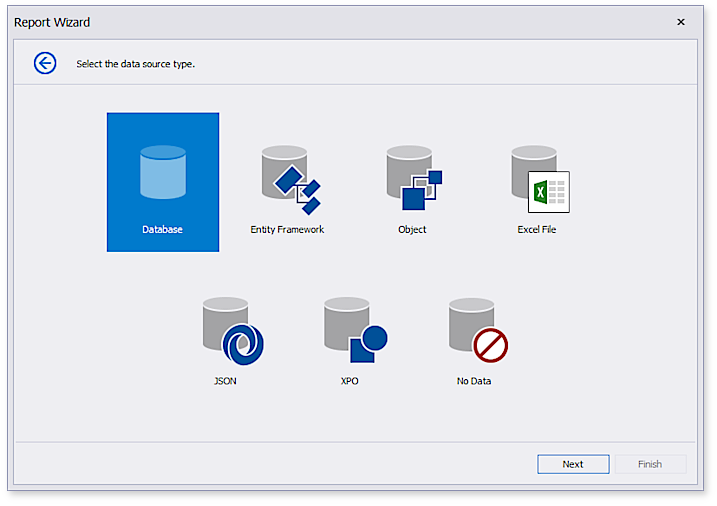
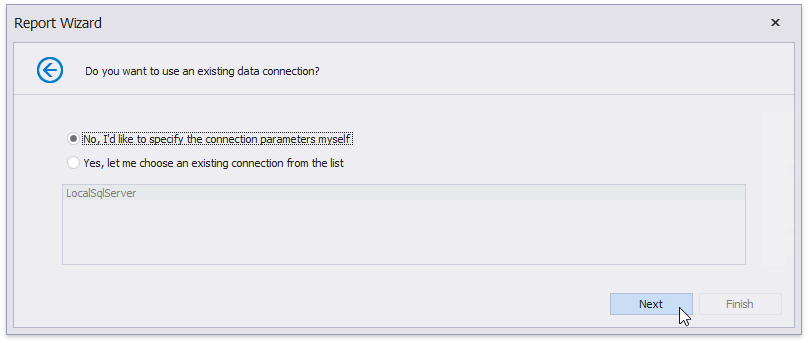
On the next wizard page, choose Database and click Next to proceed.
On the next page, select the first option to create a new data connection. Click Next.
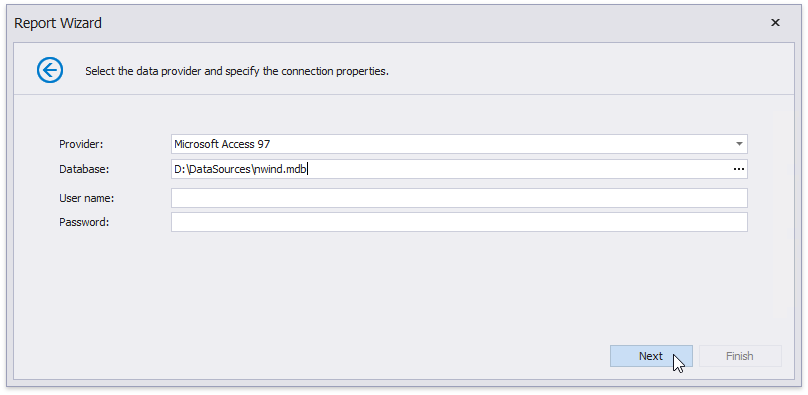
Choose Microsoft Access 97 as a data provider and specify a path to the nwind.mdb file. You can find this file in the XtraReports installation (the default path is C:\Users\Public\Public Documents\DevExpress Demos 20.2\Components\Data\nwind.mdb). Click Next to continue.
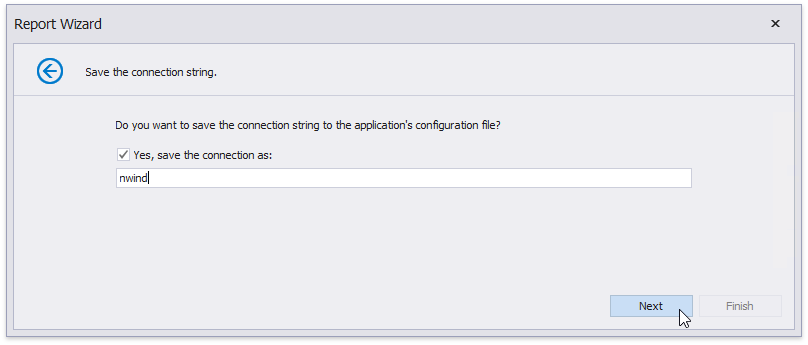
Click Next on the next page to save the connection string to the configuration file.
Choose the Categories and Products tables to add them to the report.
Click Manage Relations to specify a master-detail relationship between the selected tables.
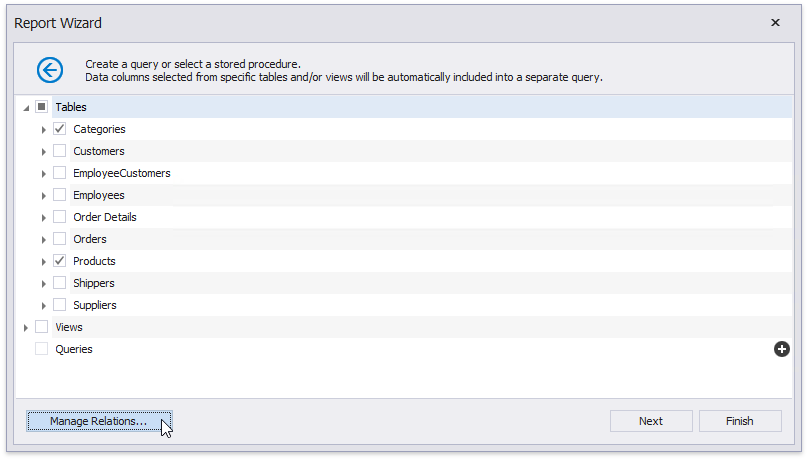
In the invoked editor, drag and drop the CategoryID key field from the master table (Categories) to the detail table (Products).
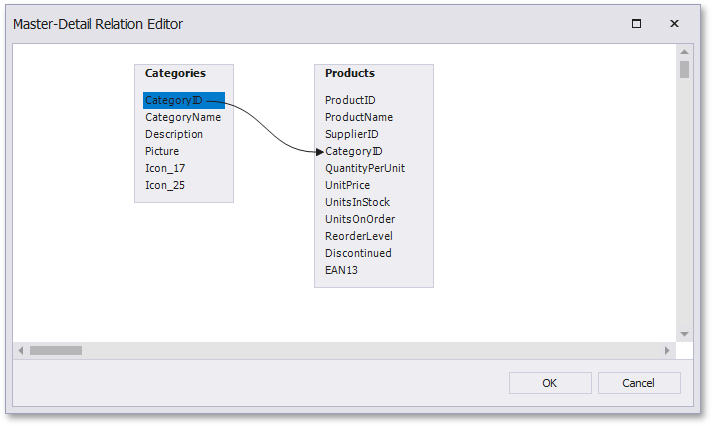
Click OK to close the editor.
Note
You can also click the Queries category’s
 button to create a custom query in the Query Builder. It allows you to join multiple tables and shape data at the data source level.
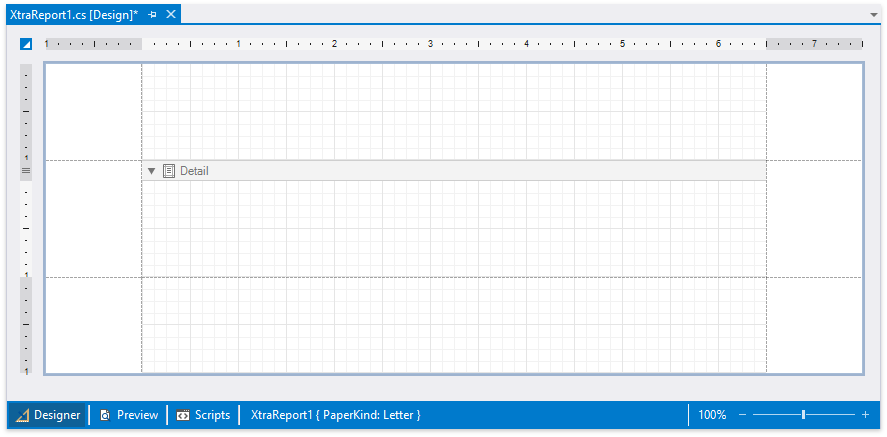
Click Finish to stop the wizard at this step and get a blank data-bound report.
The default report layout contains three different bands (Top Margin, Detail and Bottom Margin). You cannot delete these bands.
- The Top and Bottom Margins are printed once on each document page.
- The Detail band is printed for every record in a report’s data source.
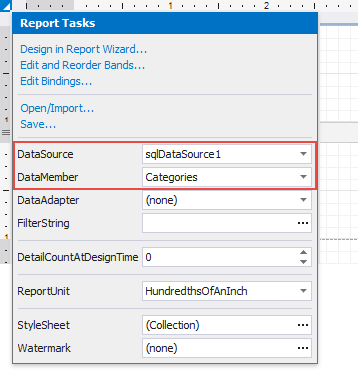
The report’s DataSource property is set to the created data source object. The DataMember property is set to the Categories master table.
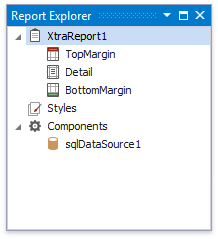
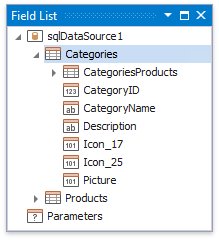
The Report Explorer displays the report structure in a tree-like form and provides access to report components. The Field List reflects a data source’s hierarchy.
Next Lesson: Lesson 2 - Create a Master-Detail Layout