Calculate an Advanced Summary
- 2 minutes to read
This document describes how to calculate an advanced summary for report groups using a built-in summary function and arithmetical or logical functions.
Note
You can use this approach to calculating summaries when the UserDesignerOptions.DataBindingMode is set to DataBindingMode.Expressions or DataBindingMode.ExpressionsAdvanced.
See Calculate a Custom Summary to learn about the legacy approach of solving this task by handling report controls’ events.
See Data Binding Modes to learn more about the available binding modes.
- Create a new report or open an existing one and bind it to a data source.
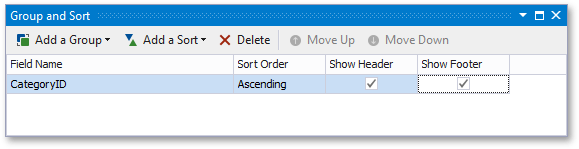
Switch to the Group and Sort panel and group the report’s data by the required field. Display the footer for the created group.
Prepare the report layout.
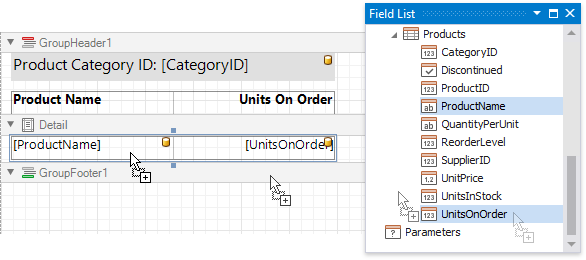
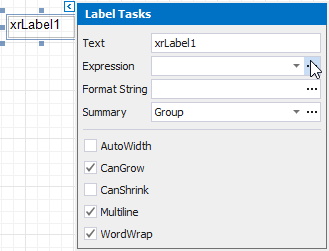
Drop an XRLabel onto the group footer to display the summary result.
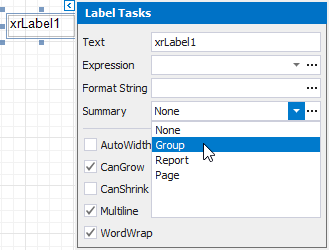
Click the label’s smart tag and set its Summary property to Group.
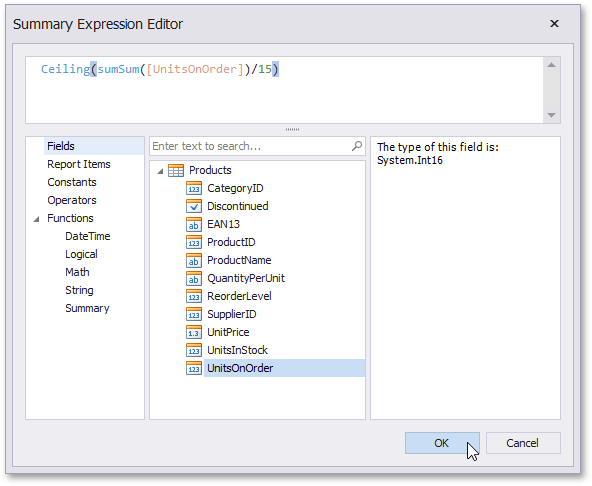
Click the ellipsis button for the label’s Expression property.
This invokes the Summary Expression Editor where you can specify a custom expression with the required summary functions and other logical or arithmetical functions. For example:
Tip
See the Expression Constants, Operators, and Functions topic for a complete list of supported summary functions.
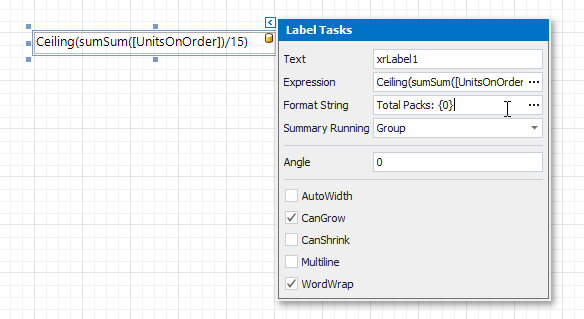
You can use the FormatString property to format the summary’s value:
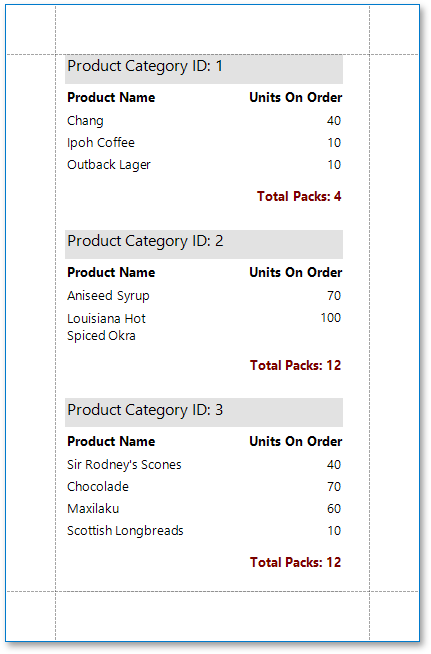
When switching to Print Preview, you can view the specified range’s custom summary result: