Summary Overview
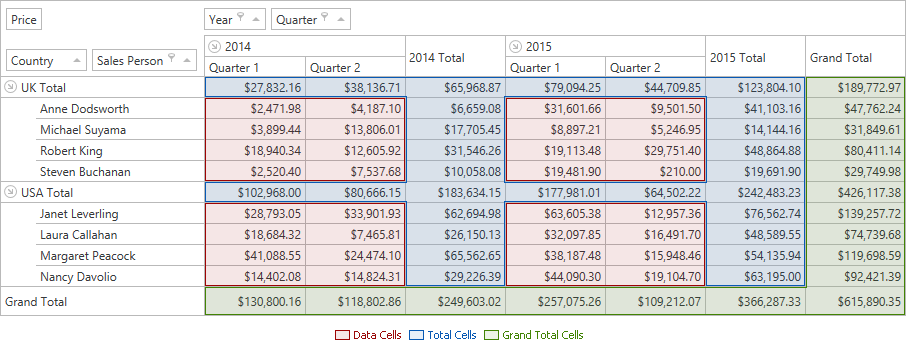
Cells in the Pivot Grid control display the results of summaries calculated against data fields. Summaries are calculated for a subset of records from the grid’s underlying data source. All the records in this subset have matching values in a column field(s) and row field(s) and these values are identified by column and row headers. Summary values are displayed within cells in the Data Area.
The DXPivotGrid supports two types of summaries:
- Automatic summaries are always calculated against data fields. The type of the summary function is specified by the data field’s PivotGridField.SummaryType property.
- Custom summaries allow you to manually calculate summaries using custom algorithms. For instance, you can involve multiple data fields in summary calculation or calculate a summary for individual records.
For information on how to obtain summary values, see Accessing Summary Values and Obtaining Underlying Data.