VCL Charts: Doughnut View Tutorial. Step 3. Appearance Customization
- 3 minutes to read
The previous step explained how to display and customize value and total labels for a doughnut series at design time.
This step describes how to add optional visual chart elements and customize general doughnut appearance settings.
Doughnut Series Appearance Customization
Double-click the Chart control to invoke the Chart Designer dialog if it is closed. Select the Countries series.

Adjust Hole Radius
You can shrink or expand the hole at the center of a doughnut series. To do this, expand the View node in the Object Inspector and change the HoleRadius property value.

As a result, the doughnut series changes accordingly:

Explode the Doughnut Series
You can visually separate doughnut slices to enhance chart readability. Expand the ExplodedValueOptions node in the Object Inspector and set the Mode property to TdxChartExplodedValueMode.All.

All doughnut slices appear separate from each other.

In addition, you can adjust the distance between separated doughnut slices. Set the Distance property to 15 to increase distance between slices.

This operation reduces slice areas.

Rotate the Doughnut Series
You can use the StartAngle property to rotate a doughnut series. Assign 60 to this property.

The displayed doughnut series rotates clockwise as a result.

Chart Customization
The Chart control has general settings, such as background fill and border appearance options. In addition, the control allows you to add a number of titles to explain the purpose of displayed diagrams and list additional information.
Add a Main Title
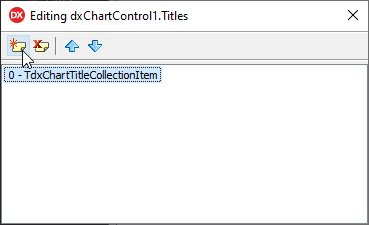
To add a main title, select the Chart control and navigate to the Titles node in the Object Inspector.
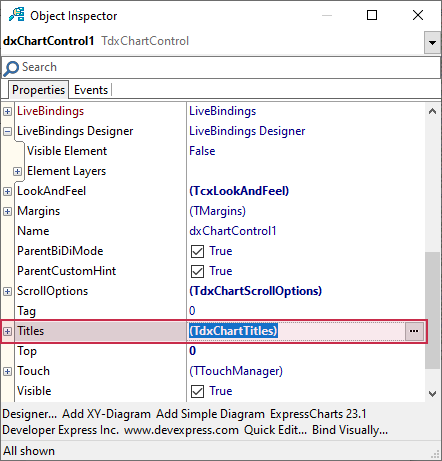
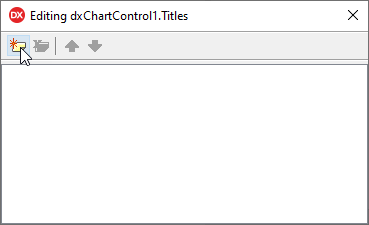
Click the ellipsis button to the right of the Titles node to invoke a built-in collection manager dialog. Then, click the Add New button to create a new chart title.
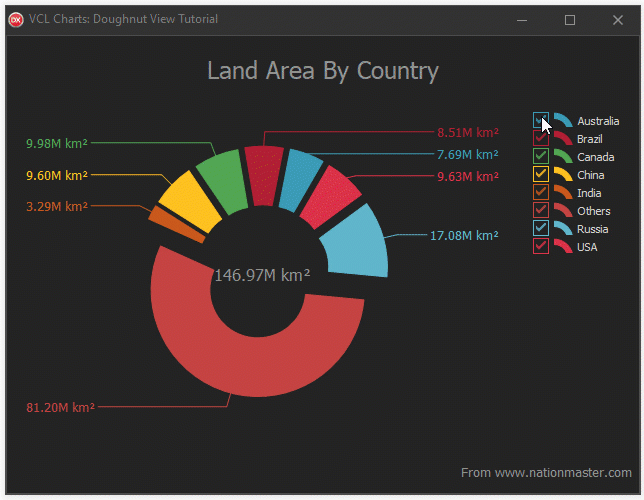
The newly created chart title is selected automatically. Assign the following string to the Text property in the Object Inspector: 'Land Area By Country'.

The main chart title is positioned above the diagram area.

The main chart title reduces the available diagram area height and shrinks the displayed doughnut. Increase the form height.

Add an Additional Chart Title
You can use extra chart titles to display additional information. For example, you can specify the original source of displayed data.
Click the Add New button to create another chart title in the title collection manager dialog.
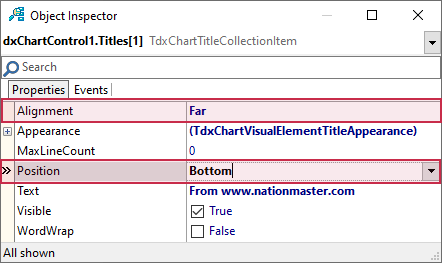
Assign the following string to the Text property of the newly created chart title: 'From www.nationmaster.com'.

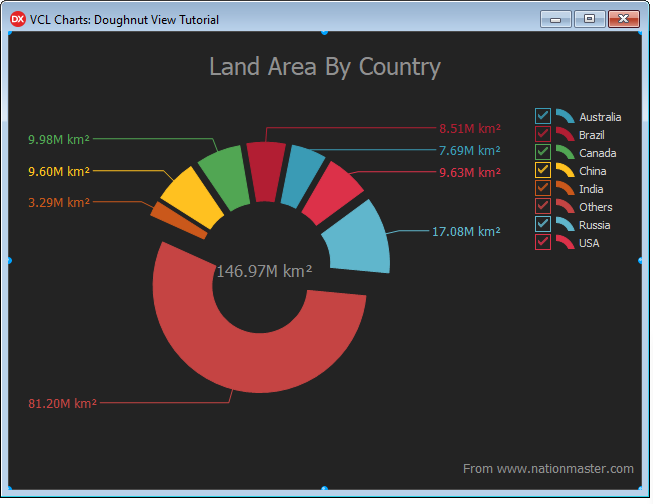
The created extra chart title appears under the main chart title.

To move the extra title to the bottom-right corner of the Chart control, follow the steps below:
- Set the Alignment property to TdxAlignment.Far.
- Change the Position property to TdxChartTitlePosition.Bottom.
The extra title is in the target position but its font size is too large.

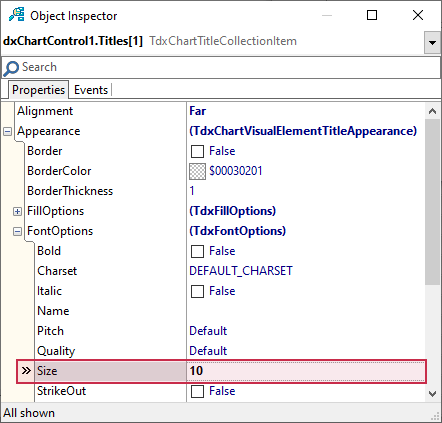
To reduce the extra title’s font size, follow the steps below:
- Expand Appearance and FontOptions nodes in the Object Inspector.
- Set the Size property to
10.
The image below shows the extra title’s final appearance.
Result
Build the project and run the resulting application. Click check boxes in the legend to hide or display the corresponding doughnut slices and their value labels.