DisplayUnitOptions Interface
Contains options used to specify the display units for the value axis.
Namespace: DevExpress.Spreadsheet.Charts
Assembly: DevExpress.Spreadsheet.v19.1.Core.dll
Declaration
Remarks
Use the Axis.DisplayUnits property to access an object exposing the DisplayUnitOptions interface.
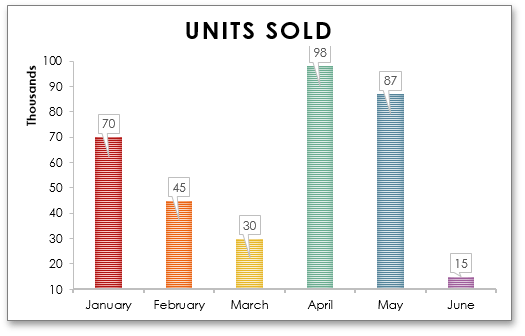
Utilize the object’s DisplayUnitOptions.UnitType and DisplayUnitOptions.CustomUnit properties to change the units displayed on the value axis and shorten the text of the axis labels. To show a label that describes what the specified units express, utilize the DisplayUnitOptions.ShowLabel and DisplayUnitOptions.Label properties.
The image below shows the chart with the value axis scale set to Thousands (the chart is displayed in Microsoft® Excel®).
Example
The example below demonstrates how to create a clustered column chart and specify the display units for the value axis by utilizing the Axis.DisplayUnits property. This property provides access to the DisplayUnitOptions object containing display unit settings. Set the DisplayUnitOptions.UnitType property to DisplayUnitType.Thousands to divide values on the axis by 1,000. To show the display unit label, set the DisplayUnitOptions.ShowLabel property to true.
Note
A complete sample project is available at https://github.com/DevExpress-Examples/spreadsheet-document-server-chart-api-t132724
Worksheet worksheet = workbook.Worksheets["chartTask7"];
workbook.Worksheets.ActiveWorksheet = worksheet;

// Create a chart and specify its location.
Chart chart = worksheet.Charts.Add(ChartType.ColumnClustered, worksheet["B2:C8"]);
chart.TopLeftCell = worksheet.Cells["F2"];
chart.BottomRightCell = worksheet.Cells["N17"];

// Change the scale of the value axis.
AxisCollection axisCollection = chart.PrimaryAxes;
Axis valueAxis = axisCollection[1];
valueAxis.Scaling.AutoMax = false;
valueAxis.Scaling.Max = 8000000;
valueAxis.Scaling.AutoMin = false;
valueAxis.Scaling.Min = 0;

// Specify display units for the value axis.
valueAxis.DisplayUnits.UnitType = DisplayUnitType.Thousands;
valueAxis.DisplayUnits.ShowLabel = true;

// Set the chart style.
chart.Style = ChartStyle.ColorBevel;
chart.Views[0].VaryColors = true;

// Hide the legend.
chart.Legend.Visible = false;