Trendline Interface
A trendline in a chart that shows trends in the series data.
Namespace: DevExpress.Spreadsheet.Charts
Assembly: DevExpress.Spreadsheet.v19.1.Core.dll
Declaration
Remarks
The Trendline object is contained within the TrendlineCollection collection. The Series.Trendlines property provides access to a collection that contains all trendlines for a specified series.
The following code uses the TrendlineCollection.Add method to display a trendline of the ChartTrendlineType.Polynomial type. The Trendline object in the collection is customized as required.
Note
A complete sample project is available at https://github.com/DevExpress-Examples/spreadsheet-document-server-chart-api-t132724
Worksheet worksheet = workbook.Worksheets["chartTask3"];
workbook.Worksheets.ActiveWorksheet = worksheet;
// Create a chart and specify its location.
Chart chart = worksheet.Charts.Add(ChartType.ScatterMarkers);
chart.SelectData(worksheet["C2:F3"], ChartDataDirection.Row);
chart.TopLeftCell = worksheet.Cells["H2"];
chart.BottomRightCell = worksheet.Cells["N14"];
// Set the minimum and maximum values for the chart value axis.
Axis axis = chart.PrimaryAxes[1];
axis.Scaling.AutoMax = false;
axis.Scaling.AutoMin = false;
axis.Scaling.Min = 0.6;
axis.Scaling.Max = 1.0;
chart.PrimaryAxes[1].MajorGridlines.Visible = false;
// Display a polynomial trendline.
chart.Series[0].Trendlines.Add(ChartTrendlineType.Polynomial);
// Customize the trendline.
Trendline tline = chart.Series[0].Trendlines[0];
tline.DisplayEquation = true;
tline.CustomName = "Trend";
tline.DisplayRSquare = true;
tline.Backward = 1;
tline.Forward = 2;
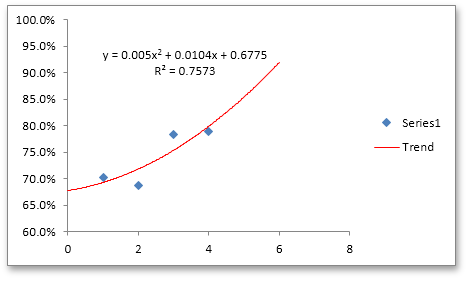
tline.Outline.SetSolidFill(Color.Red);
The resulting chart is shown in the following picture.
See Also