DisplayUnitOptions.UnitType Property
Get or sets the display units for the value axis.
Namespace: DevExpress.Spreadsheet.Charts
Assembly: DevExpress.Spreadsheet.v19.1.Core.dll
Declaration
Property Value
| Type | Description |
|---|---|
| DisplayUnitType | A DisplayUnitType enumeration value specifying the type of display unit scaling applied to the value axis. |
Property Paths
You can access this nested property as listed below:
| Object Type | Path to UnitType |
|---|---|
| Axis |
|
Remarks
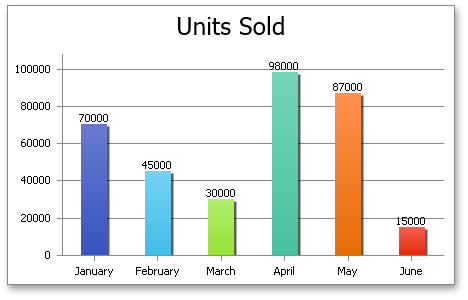
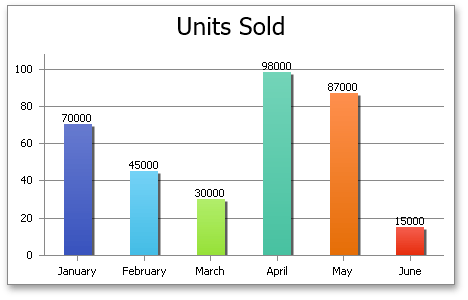
Use the UnitType property to make the value axis labels easier to read when you plot large numbers on the chart. For example, if the value axis stretches from 10,000 to 100,000, set the UnitType property to DisplayUnitType.Thousands to change the scaling value and display numbers on the value axis as 10 to 100. To show the display unit label, set the DisplayUnitOptions.ShowLabel property to true.
The following images demonstrate how the UnitType property works.
| UnitType = DisplayUnitType.None | UnitType = DisplayUnitType.Thousands |
|---|---|
 |
 |
Example
The example below demonstrates how to create a clustered column chart and specify the display units for the value axis by utilizing the Axis.DisplayUnits property. This property provides access to the DisplayUnitOptions object containing display unit settings. Set the DisplayUnitOptions.UnitType property to DisplayUnitType.Thousands to divide values on the axis by 1,000. To show the display unit label, set the DisplayUnitOptions.ShowLabel property to true.
Note
A complete sample project is available at https://github.com/DevExpress-Examples/spreadsheet-document-server-chart-api-t132724
Worksheet worksheet = workbook.Worksheets["chartTask7"];
workbook.Worksheets.ActiveWorksheet = worksheet;

// Create a chart and specify its location.
Chart chart = worksheet.Charts.Add(ChartType.ColumnClustered, worksheet["B2:C8"]);
chart.TopLeftCell = worksheet.Cells["F2"];
chart.BottomRightCell = worksheet.Cells["N17"];

// Change the scale of the value axis.
AxisCollection axisCollection = chart.PrimaryAxes;
Axis valueAxis = axisCollection[1];
valueAxis.Scaling.AutoMax = false;
valueAxis.Scaling.Max = 8000000;
valueAxis.Scaling.AutoMin = false;
valueAxis.Scaling.Min = 0;

// Specify display units for the value axis.
valueAxis.DisplayUnits.UnitType = DisplayUnitType.Thousands;
valueAxis.DisplayUnits.ShowLabel = true;

// Set the chart style.
chart.Style = ChartStyle.ColorBevel;
chart.Views[0].VaryColors = true;

// Hide the legend.
chart.Legend.Visible = false;