ChartView.Overlap Property
Gets or sets the overlap value between bars or columns in a 2-D Bar or Column chart.
Namespace: DevExpress.Spreadsheet.Charts
Assembly: DevExpress.Spreadsheet.v18.2.Core.dll
Declaration
Property Value
| Type | Description |
|---|---|
| Int32 | An integer value that is the percentage of series overlap. This value must be between -100 and 100. |
Remarks
Use the Overlap property to specify the overlap of bars or columns in the same category on a two-dimensional bar or column chart. Note that this option takes effect only when the chart contains more than one series. The default value for this property is 0, so that bars or columns adjoin each other, but do not overlap.
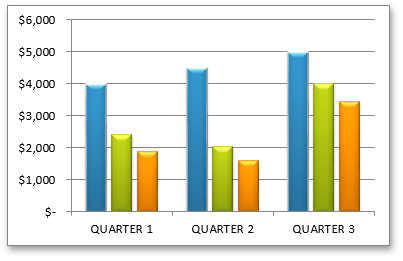
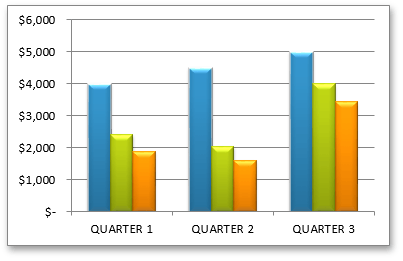
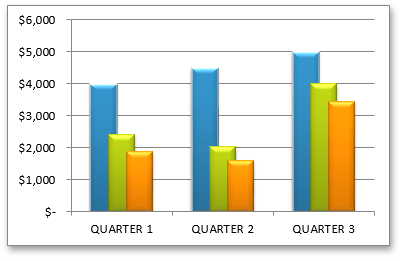
The following images demonstrate how the Overlap property works for the clustered column chart (the chart is displayed in Microsoft® Excel®)
| Overlap = -30% | Overlap = 0% | Overlap = 30% |
|---|---|---|
 |
 |
 |
Note
Currently, the SpeadsheetControl does not display the overlapped bars or columns. However, display settings are loaded and stored in supported formats, and you can modify them programmatically.