ChartView.SplitType Property
Gets or sets a value that specifies the way to split the data points between the main chart and secondary chart in a Pie of Pie or Bar of Pie chart type.
Namespace: DevExpress.Spreadsheet.Charts
Assembly: DevExpress.Spreadsheet.v18.2.Core.dll
Declaration
Property Value
| Type | Description |
|---|---|
| OfPieSplitType | An OfPieSplitType enumeration value specifying the way to split a Pie of Pie or Bar of Pie chart. |
Available values:
| Name | Description |
|---|---|
| Auto | Specifies that the data points should be automatically split between the main and secondary chart in a Pie of Pie or Bar of Pie chart type. |
| Custom | Specifies that the data points should be split between the main and secondary chart in a Pie of Pie or Bar of Pie chart type according to the values defined by the ChartView.SecondPiePoints property. |
| Percent | Specifies that the data points should be split between the main and secondary chart in a Pie of Pie or Bar of Pie chart type by placing the data points with percentage less than percent value defined by the ChartView.SplitPosition property in the second chart. |
| Position | Specifies that the data points should be split between the main and secondary chart in a Pie of Pie or Bar of Pie chart type by placing the last data points, whose number is defined by the ChartView.SplitPosition property, in the second chart. |
| Value | Specifies that the data points should be split between the main and secondary chart in a Pie of Pie or Bar of Pie chart type by placing the data points, whose values are less than the value defined by the ChartView.SplitPosition property, in the second chart. |
Remarks
Use the SplitType property to determine how to split a Pie of Pie or Bar of Pie chart, and then set the ChartView.SplitPosition property (or the ChartView.SecondPiePoints property if the custom split is specified) to adjust the number of data points that appear in the secondary chart.
Note
Currently, the SpeadsheetControl does not display the Pie of Pie or Bar of Pie chart types. However, they can be loaded and stored in supported formats, and you can create and modify them programmatically.
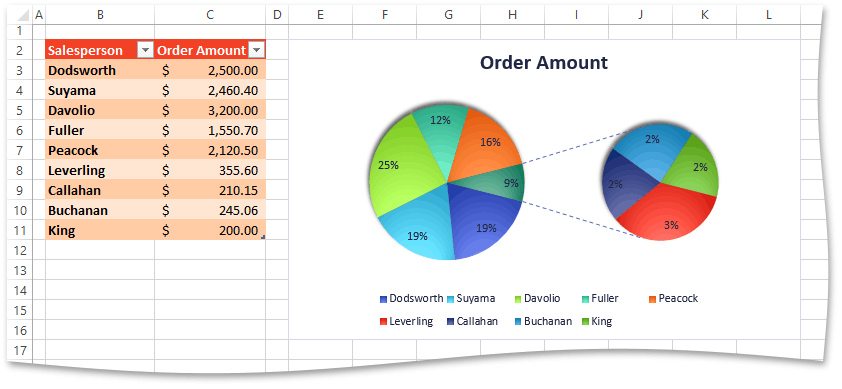
The image below shows the Pie of Pie chart with the secondary chart containing the four smallest values (the workbook is opened in Microsoft® Excel®).
Example
The example below demonstrates how to create a Pie of Pie chart and specify the number of data points that should appear in the secondary chart by setting the ChartView.SplitType and ChartView.SplitPosition properties. In this example, the last four values will be displayed in the secondary pie chart.
Note
A complete sample project is available at https://github.com/DevExpress-Examples/spreadsheet-document-server-chart-api-t132724
Worksheet worksheet = workbook.Worksheets["chartTask6"];
workbook.Worksheets.ActiveWorksheet = worksheet;

// Create a Pie of Pie chart and specify its position.
Chart chart = worksheet.Charts.Add(ChartType.PieOfPie, worksheet["B2:C11"]);
chart.TopLeftCell = worksheet.Cells["E2"];
chart.BottomRightCell = worksheet.Cells["L16"];

// Specify the number of data points to be displayed in the secondary chart (the last four values).
chart.Views[0].SplitType = OfPieSplitType.Position;
chart.Views[0].SplitPosition = 4;

// Show data labels as percentage values.
chart.Views[0].DataLabels.ShowPercent = true;
Related GitHub Examples
The following code snippet (auto-collected from DevExpress Examples) contains a reference to the SplitType property.
Note
The algorithm used to collect these code examples remains a work in progress. Accordingly, the links and snippets below may produce inaccurate results. If you encounter an issue with code examples below, please use the feedback form on this page to report the issue.