How to: Change the Appearance of Series Points
- 2 minutes to read
This topic describes how to format series points.
Change the Appearance of Individual Data Points
To change a data point’s appearance, add a new item to the Series.CustomDataPoints collection with the index equal to the zero-based position of the modified data point in the series. Then, use the following members to specify the data point’s fill and outline settings:
- ShapeFormatBase.Fill - allows you to fill the data point with a solid color, gradient, picture, or pattern.
- ShapeFormatBase.Outline - allows you to specify the color, width, and line style for the data point’s border.
// Create a chart and specify its location.
Chart chart = worksheet.Charts.Add(ChartType.ColumnClustered, worksheet["B2:C8"]);
chart.TopLeftCell = worksheet.Cells["F2"];
chart.BottomRightCell = worksheet.Cells["L15"];
// Hide the chart's legend.
chart.Legend.Visible = false;
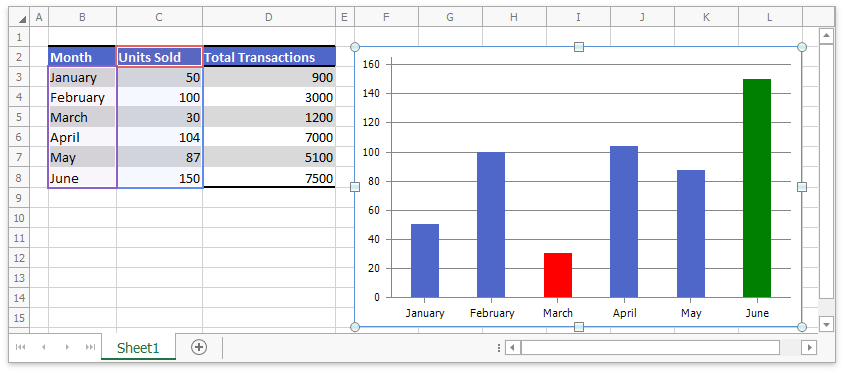
// Fill the third data point with red color.
chart.Series[0].CustomDataPoints.Add(2).Fill.SetSolidFill(Color.Red);
// Fill the sixth data point with green color.
chart.Series[0].CustomDataPoints.Add(5).Fill.SetSolidFill(Color.Green);
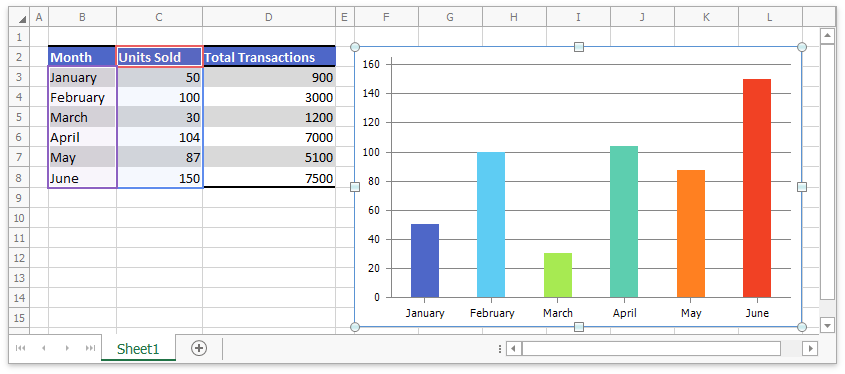
Apply Different Colors to Same-Series Data Points
The following example shows how to use the ChartView.VaryColors property to apply a different color to each data marker in the series.
// Create a chart and specify its location.
Chart chart = worksheet.Charts.Add(ChartType.ColumnClustered, worksheet["B2:C8"]);
chart.TopLeftCell = worksheet.Cells["F2"];
chart.BottomRightCell = worksheet.Cells["L15"];

// Specify that each data point in the series has a different color.
chart.Views[0].VaryColors = true;
// Hide the legend.
chart.Legend.Visible = false;