Create a Custom Data Adapter
- 2 minutes to read
There are two ways to populate a chart with data:
- use the built-in DataAdapter (the workflow is described in the getting-started lessons for cartesian and pie charts);
- create a custom data adapter (for example, it is useful when the data is generated on the fly and you don’t need to store it).
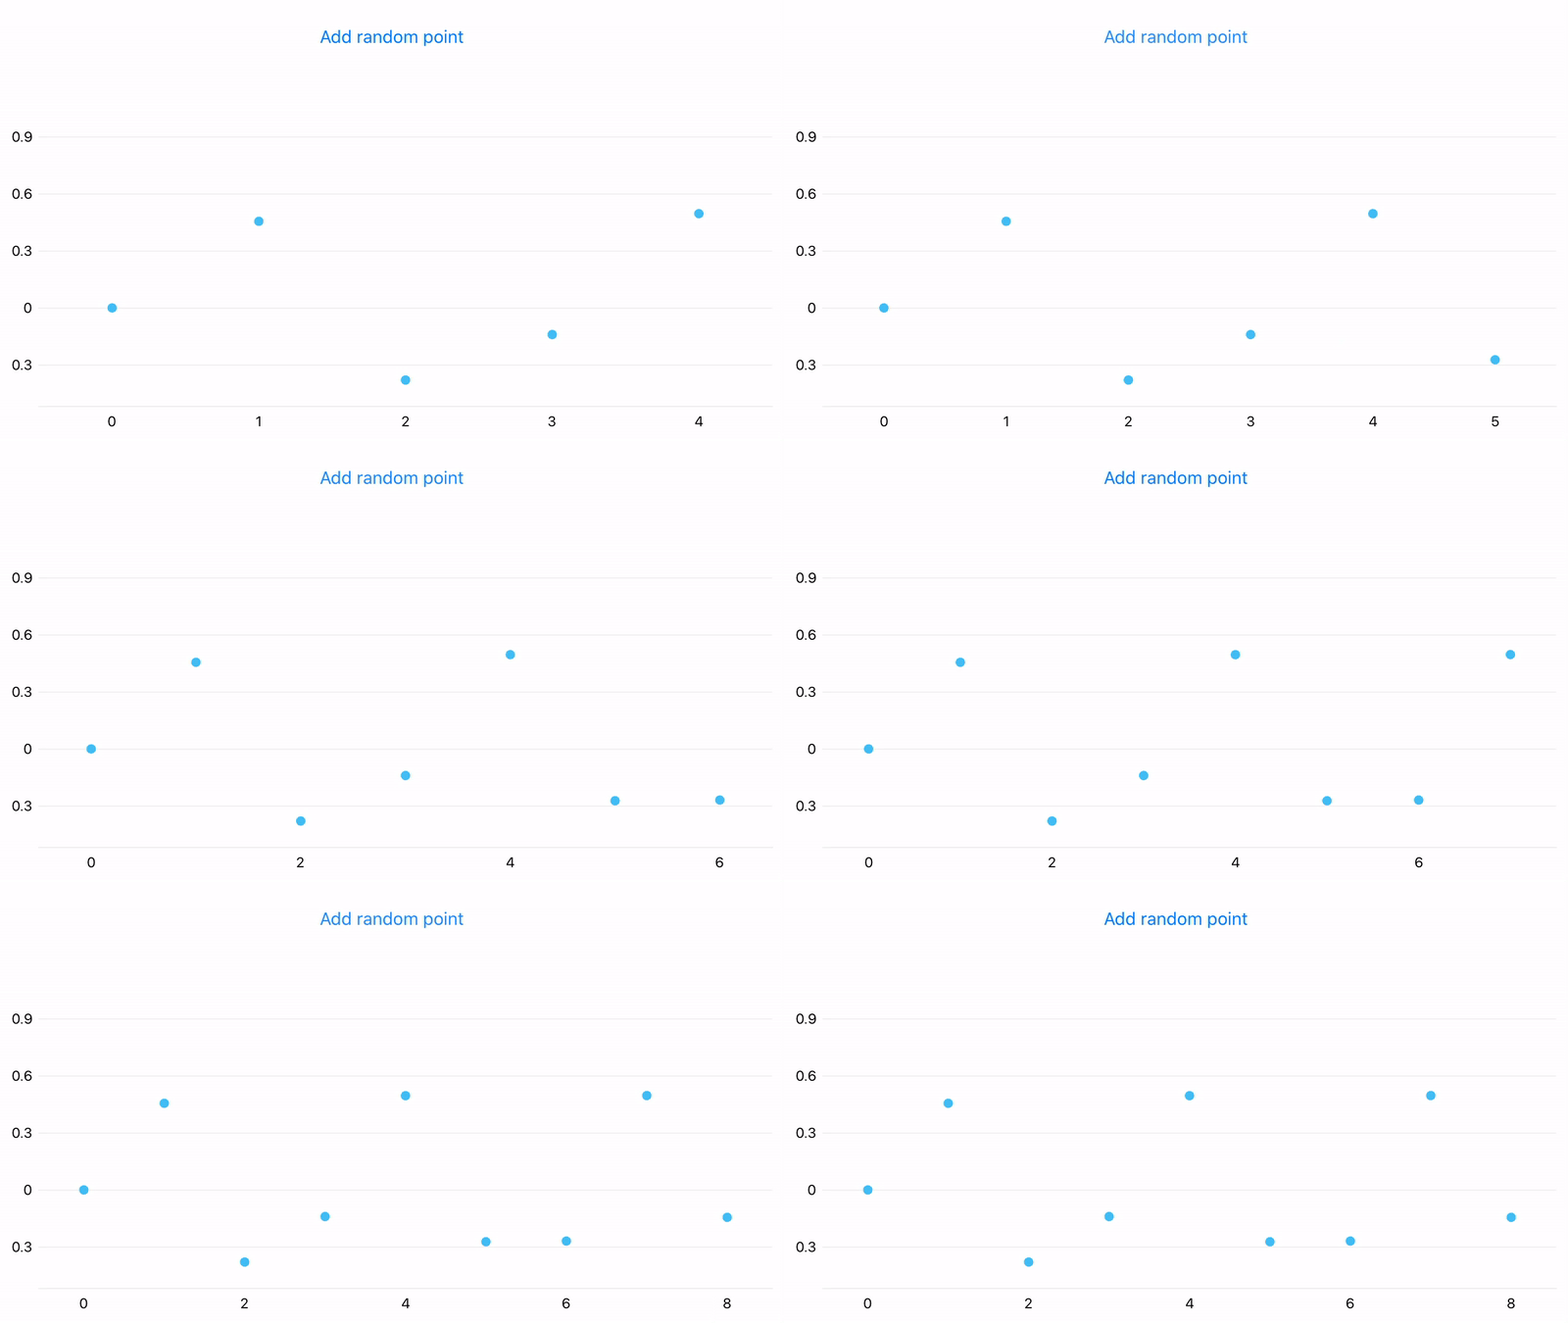
This example shows how to fill a chart with random data points generated when the user clicks a button. In this case, you don’t need to store the data, so you can bind it to a ChartView using a custom data adapter.
In the code-behind MainPage.xaml.cs file, create a new class that:
- implements the IXYSeriesData interface to provide data values;
- implements the IChangeableSeriesData interface and raises the IChangeableSeriesData.DataChanged event. This event refreshes the chart series data (in the current example, it adds new data points to the chart).
using System;
using System.Collections.Generic;
using Xamarin.Forms;
using DevExpress.XamarinForms.Charts;

namespace TestApp {
    public class CustomDataAdapter : BindableObject, IXYSeriesData, IChangeableSeriesData {
        const int MaxDataCount = 30;
        int dataCount = 0;
        int offset = 0;

        public event DataChangedEventHandler DataChanged;

        public void Next() {
            dataCount++;
            DataChanged?.Invoke(this, DataChangedEventArgs.Add());
            if (dataCount > MaxDataCount) {
                offset++;
                dataCount = MaxDataCount;
                DataChanged?.Invoke(this, DataChangedEventArgs.Remove(0));
            }
        }

        int IXYSeriesData.GetDataCount() => dataCount;
        SeriesDataType IXYSeriesData.GetDataType() => SeriesDataType.Numeric;
        object IXYSeriesData.GetKey(int index) => index;
        double IXYSeriesData.GetNumericArgument(int index) => offset + index;
        DateTime IXYSeriesData.GetDateTimeArgument(int index) => throw new NotImplementedException();
        string IXYSeriesData.GetQualitativeArgument(int index) => throw new NotImplementedException();

        double IXYSeriesData.GetValue(DevExpress.XamarinForms.Charts.ValueType valueType, int index) {
            switch (valueType) {
                case DevExpress.XamarinForms.Charts.ValueType.Value:
                    double argument = index + offset;
                    return Math.Sin(argument) * Math.Cos(argument);
            }
            return 0.0;
        }
    }
}
In the MainPage.xaml file, create a new PointSeries object, set its Data property to the custom adapter, and add it to the ChartView.Series collection.
<ContentPage
    xmlns="http://xamarin.com/schemas/2014/forms"
    xmlns:x="http://schemas.microsoft.com/winfx/2009/xaml"
    xmlns:dxc="http://schemas.devexpress.com/xamarin/2014/forms/charts"
    xmlns:local="clr-namespace:TestApp"
    x:Class="TestApp.MainPage">

    <dxc:ChartView x:Name="chart">
        <dxc:ChartView.Series>
            <dxc:PointSeries>
                <dxc:PointSeries.Data>
                    <local:CustomDataAdapter/>
                </dxc:PointSeries.Data>
            </dxc:PointSeries>
        </dxc:ChartView.Series>
    </dxc:ChartView>
</ContentPage>
Add the button that will refresh the chart data.
<Button HorizontalOptions="FillAndExpand" Clicked="Button_Click" Text="Add random point"/>
using System;
using System.Collections.Generic;
using Xamarin.Forms;
using DevExpress.XamarinForms.Charts;

namespace TestApp {
    public partial class MainPage : ContentPage {
        public MainPage() {
            InitializeComponent();
        }
        private void Button_Click(object sender, System.EventArgs e) {
            PointSeries pointSeries = (PointSeries)chart.Series[0];
            CustomDataAdapter dataAdapter = (CustomDataAdapter)pointSeries.Data;
            dataAdapter.Next();
        }
    }
    //..
}
Now, when a user clicks the Add random point button, a new point appears on the chart.
