Lesson 2: Create a Cartesian Chart
- 5 minutes to read
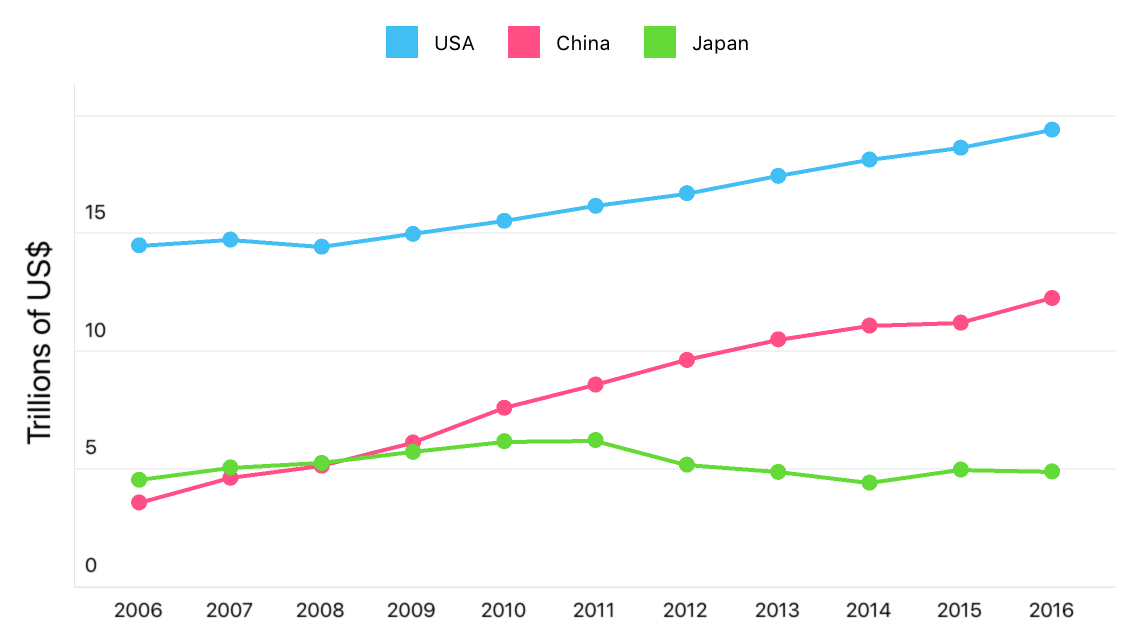
This guide explains how to use the Chart View and develop an application that displays three countries’ annual GDP in the Cartesian coordinate system.
Step 1: Create a New Application and Add a Chart View
Create a new Xamarin.Forms cross-platform solution and include the DevExpress Charts component.
In the main project’s App.xaml.cs file, call the DevExpress.XamarinForms.Charts.Initializer.Init() method to prepare DevExpress Charts for use in the application.
using Xamarin.Forms;

namespace ChartExample {
    public partial class App : Application {
        public App() {
            DevExpress.XamarinForms.Charts.Initializer.Init();
            InitializeComponent();
            MainPage = new MainPage();
        }
    }
}
In the iOS project’s AppDelegate.cs file, call the DevExpress.XamarinForms.Charts.iOS.Initializer.Init() method.
using Foundation;
using UIKit;

namespace ChartExample.iOS {
    [Register("AppDelegate")]
    public partial class AppDelegate : global::Xamarin.Forms.Platform.iOS.FormsApplicationDelegate {
        public override bool FinishedLaunching(UIApplication app, NSDictionary options) {
            global::Xamarin.Forms.Forms.Init();
            DevExpress.XamarinForms.Charts.iOS.Initializer.Init();
            LoadApplication(new App());

            return base.FinishedLaunching(app, options);
        }
    }
}
Tip
If you use the DevExpress Xamarin App v22.1 template to create an application, these method calls are automatically added to the code.
In the MainPage.xaml file of the .NET Standard project containing the shared code, use the dxc prefix to declare a namespace and replace the default page content with the ChartView control:
<ContentPage xmlns="http://xamarin.com/schemas/2014/forms"
            xmlns:x="http://schemas.microsoft.com/winfx/2009/xaml"
            xmlns:dxc="http://schemas.devexpress.com/xamarin/2014/forms/charts"
            x:Class="GettingStartedLesson2.MainPage">
    <dxc:ChartView x:Name="chart">
    </dxc:ChartView>
</ContentPage>
Step 2: Populate the Chart View with data
Create a new MainViewModel.cs file and add the following classes to it:
public class MainViewModel {
    public CountryGdp GdpValueForUSA { get; }
    public CountryGdp GdpValueForChina { get; }
    public CountryGdp GdpValueForJapan { get; }

    public MainViewModel() {
        GdpValueForUSA = new CountryGdp(
            "USA",
            new GdpValue(new DateTime(2017, 1, 1), 19.391),
            new GdpValue(new DateTime(2016, 1, 1), 18.624),
            new GdpValue(new DateTime(2015, 1, 1), 18.121),
            new GdpValue(new DateTime(2014, 1, 1), 17.428),
            new GdpValue(new DateTime(2013, 1, 1), 16.692),
            new GdpValue(new DateTime(2012, 1, 1), 16.155),
            new GdpValue(new DateTime(2011, 1, 1), 15.518),
            new GdpValue(new DateTime(2010, 1, 1), 14.964),
            new GdpValue(new DateTime(2009, 1, 1), 14.419),
            new GdpValue(new DateTime(2008, 1, 1), 14.719),
            new GdpValue(new DateTime(2007, 1, 1), 14.478)
        );
        GdpValueForChina = new CountryGdp(
            "China",
            new GdpValue(new DateTime(2017, 1, 1), 12.238),
            new GdpValue(new DateTime(2016, 1, 1), 11.191),
            new GdpValue(new DateTime(2015, 1, 1), 11.065),
            new GdpValue(new DateTime(2014, 1, 1), 10.482),
            new GdpValue(new DateTime(2013, 1, 1), 9.607),
            new GdpValue(new DateTime(2012, 1, 1), 8.561),
            new GdpValue(new DateTime(2011, 1, 1), 7.573),
            new GdpValue(new DateTime(2010, 1, 1), 6.101),
            new GdpValue(new DateTime(2009, 1, 1), 5.110),
            new GdpValue(new DateTime(2008, 1, 1), 4.598),
            new GdpValue(new DateTime(2007, 1, 1), 3.552)
        );
        GdpValueForJapan = new CountryGdp(
            "Japan",
            new GdpValue(new DateTime(2017, 1, 1), 4.872),
            new GdpValue(new DateTime(2016, 1, 1), 4.949),
            new GdpValue(new DateTime(2015, 1, 1), 4.395),
            new GdpValue(new DateTime(2014, 1, 1), 4.850),
            new GdpValue(new DateTime(2013, 1, 1), 5.156),
            new GdpValue(new DateTime(2012, 1, 1), 6.203),
            new GdpValue(new DateTime(2011, 1, 1), 6.156),
            new GdpValue(new DateTime(2010, 1, 1), 5.700),
            new GdpValue(new DateTime(2009, 1, 1), 5.231),
            new GdpValue(new DateTime(2008, 1, 1), 5.038),
            new GdpValue(new DateTime(2007, 1, 1), 4.515)
        );
    }
}

public class CountryGdp {
    public string CountryName { get; }
    public IList<GdpValue> Values { get; }

    public CountryGdp(string country, params GdpValue[] values) {
        this.CountryName = country;
        this.Values = new List<GdpValue>(values);
    }
}

public class GdpValue {
    public DateTime Year { get; }
    public double Value { get; }

    public GdpValue(DateTime year, double value) {
        this.Year = year;
        this.Value = value;
    }
}
In the MainPage.xaml file, add one LineSeries object for each series on the chart to the ChartView.Series collection. To provide data for the series, set the Data property of each LineSeries object to the SeriesDataAdapter class instance. Use the adapter properties to specify the data source for each series, and to define the data source members used to generate series points and labels:
<ContentPage xmlns="http://xamarin.com/schemas/2014/forms"
             xmlns:x="http://schemas.microsoft.com/winfx/2009/xaml"
             xmlns:local="clr-namespace:ChartExample"
             x:Class="ChartExample.MainPage"
             xmlns:dxc="http://schemas.devexpress.com/xamarin/2014/forms/charts">
    <ContentPage.BindingContext>
        <local:MainViewModel/>
    </ContentPage.BindingContext>
    <dxc:ChartView>
        <dxc:ChartView.Series>
            <dxc:LineSeries DisplayName="{Binding GdpValueForUSA.CountryName}">
                <dxc:LineSeries.Data>
                    <dxc:SeriesDataAdapter DataSource="{Binding GdpValueForUSA.Values}"
                                           ArgumentDataMember="Year">
                        <dxc:ValueDataMember Type="Value" Member="Value"/>
                    </dxc:SeriesDataAdapter>
                </dxc:LineSeries.Data>
            </dxc:LineSeries>

            <dxc:LineSeries DisplayName="{Binding GdpValueForChina.CountryName}">
                <dxc:LineSeries.Data>
                    <dxc:SeriesDataAdapter DataSource="{Binding GdpValueForChina.Values}"
                                           ArgumentDataMember="Year">
                        <dxc:ValueDataMember Type="Value" Member="Value"/>
                    </dxc:SeriesDataAdapter>
                </dxc:LineSeries.Data>
            </dxc:LineSeries>

            <dxc:LineSeries DisplayName="{Binding GdpValueForJapan.CountryName}">
                <dxc:LineSeries.Data>
                    <dxc:SeriesDataAdapter DataSource="{Binding GdpValueForJapan.Values}"
                                           ArgumentDataMember="Year">
                        <dxc:ValueDataMember Type="Value" Member="Value"/>
                    </dxc:SeriesDataAdapter>
                </dxc:LineSeries.Data>
            </dxc:LineSeries>
        </dxc:ChartView.Series>
    </dxc:ChartView>
</ContentPage>
Step 3. Configure Chart Axes
Configure the Chart View’s argument axis so that it shows labels for each year, and customize the value axis labels’ content and position.
In the MainPage.xaml file, create a new DateTimeAxisX class instance, configure it, and assign it to the ChartView.AxisX property:
<dxc:ChartView x:Name="chart">
    <dxc:ChartView.AxisX>
        <dxc:DateTimeAxisX MeasureUnit="Year"
                           GridAlignment="Year"
                           GridSpacing="1"/>
    </dxc:ChartView.AxisX>
</dxc:ChartView>
Note
The X-axis type should be compatible with the series data type.
Create a new NumericAxisY class instance. Use its Title and Label properties to configure axis title and labels. Assign the axis to the ChartView.AxisY property:
<dxc:ChartView x:Name="chart">
<!-- The X-axis config is here. -->
    <dxc:ChartView.AxisY>
        <dxc:NumericAxisY>
            <dxc:NumericAxisY.Title>
                <dxc:AxisTitle Text="Trillions of US$">
                    <dxc:AxisTitle.Style>
                        <dxc:TitleStyle>
                            <dxc:TitleStyle.TextStyle>
                                <dxc:TextStyle Size="16"/>
                            </dxc:TitleStyle.TextStyle>
                        </dxc:TitleStyle>
                    </dxc:AxisTitle.Style>
                </dxc:AxisTitle>
            </dxc:NumericAxisY.Title>
            <dxc:NumericAxisY.Label>
                <dxc:AxisLabel TextFormat="#.#" Position="Inside"/>
            </dxc:NumericAxisY.Label>
        </dxc:NumericAxisY>
    </dxc:ChartView.AxisY>
</dxc:ChartView>
Step 4. Add a Legend to the Chart
Create a new Legend object, modify its settings, and assign it to the ChartBaseView.Legend property:
<dxc:ChartView x:Name="chart">
<!-- The axes config is here. -->
    <dxc:ChartView.Legend>
        <dxc:Legend VerticalPosition="TopOutside"
                    HorizontalPosition="Center"
                    Orientation="LeftToRight"/>
    </dxc:ChartView.Legend>
</dxc:ChartView>
Result
Launch the application to see the results: