Lesson 2: How to Create a Cartesian Chart
- 5 minutes to read
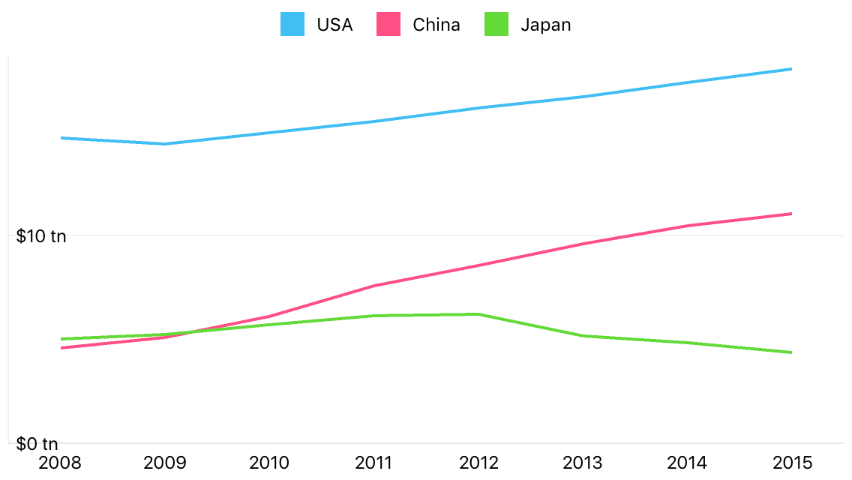
This guide introduces the DevExpress Charts Suite for iOS. You will develop an application to display the annual GDP of 3 countries. The following image demonstrates the result:
Step 1. Create a new application
First, create a new single view application and add the Cartesian Chart to it by following steps below.
Create a new application using your preferred IDE.
Import the library into the application’s project. The Import the Library guide explains how to do this.
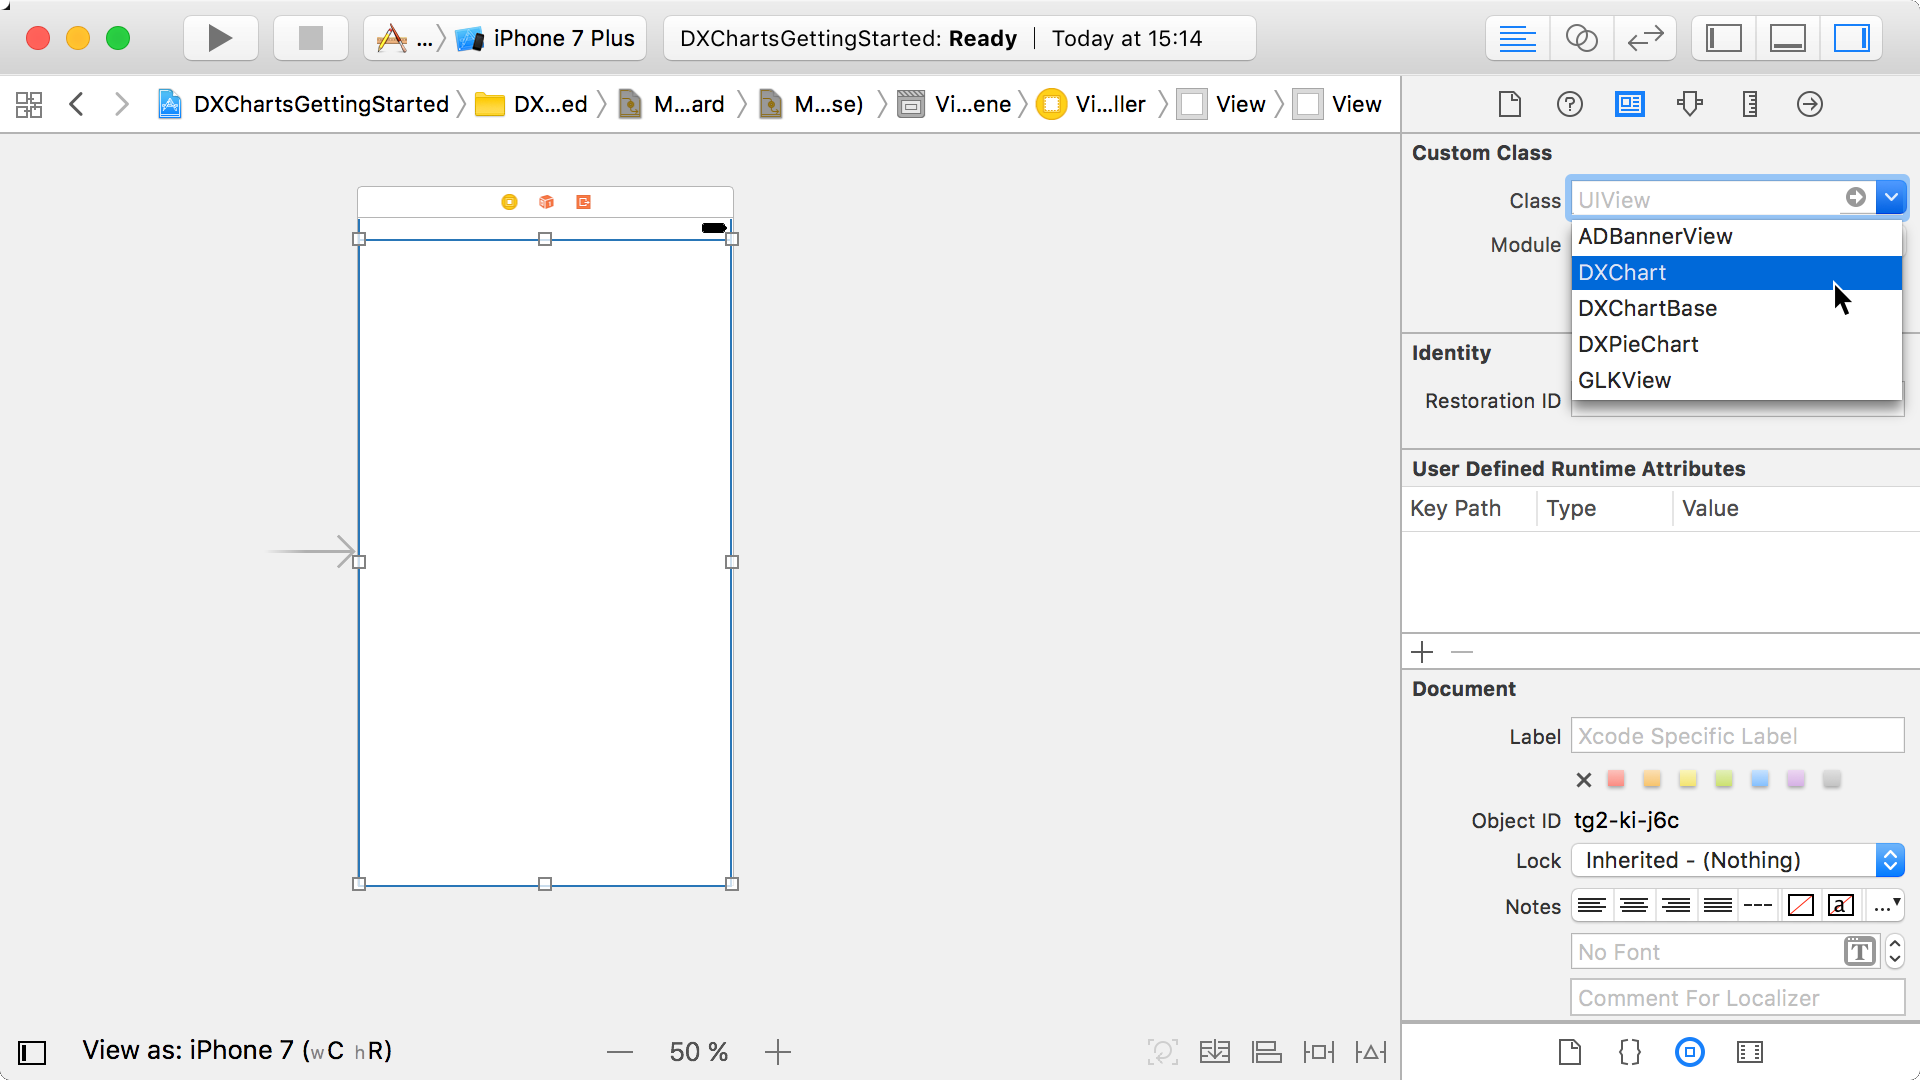
Add a new view to the Main storyboard and set its class to DXChart.
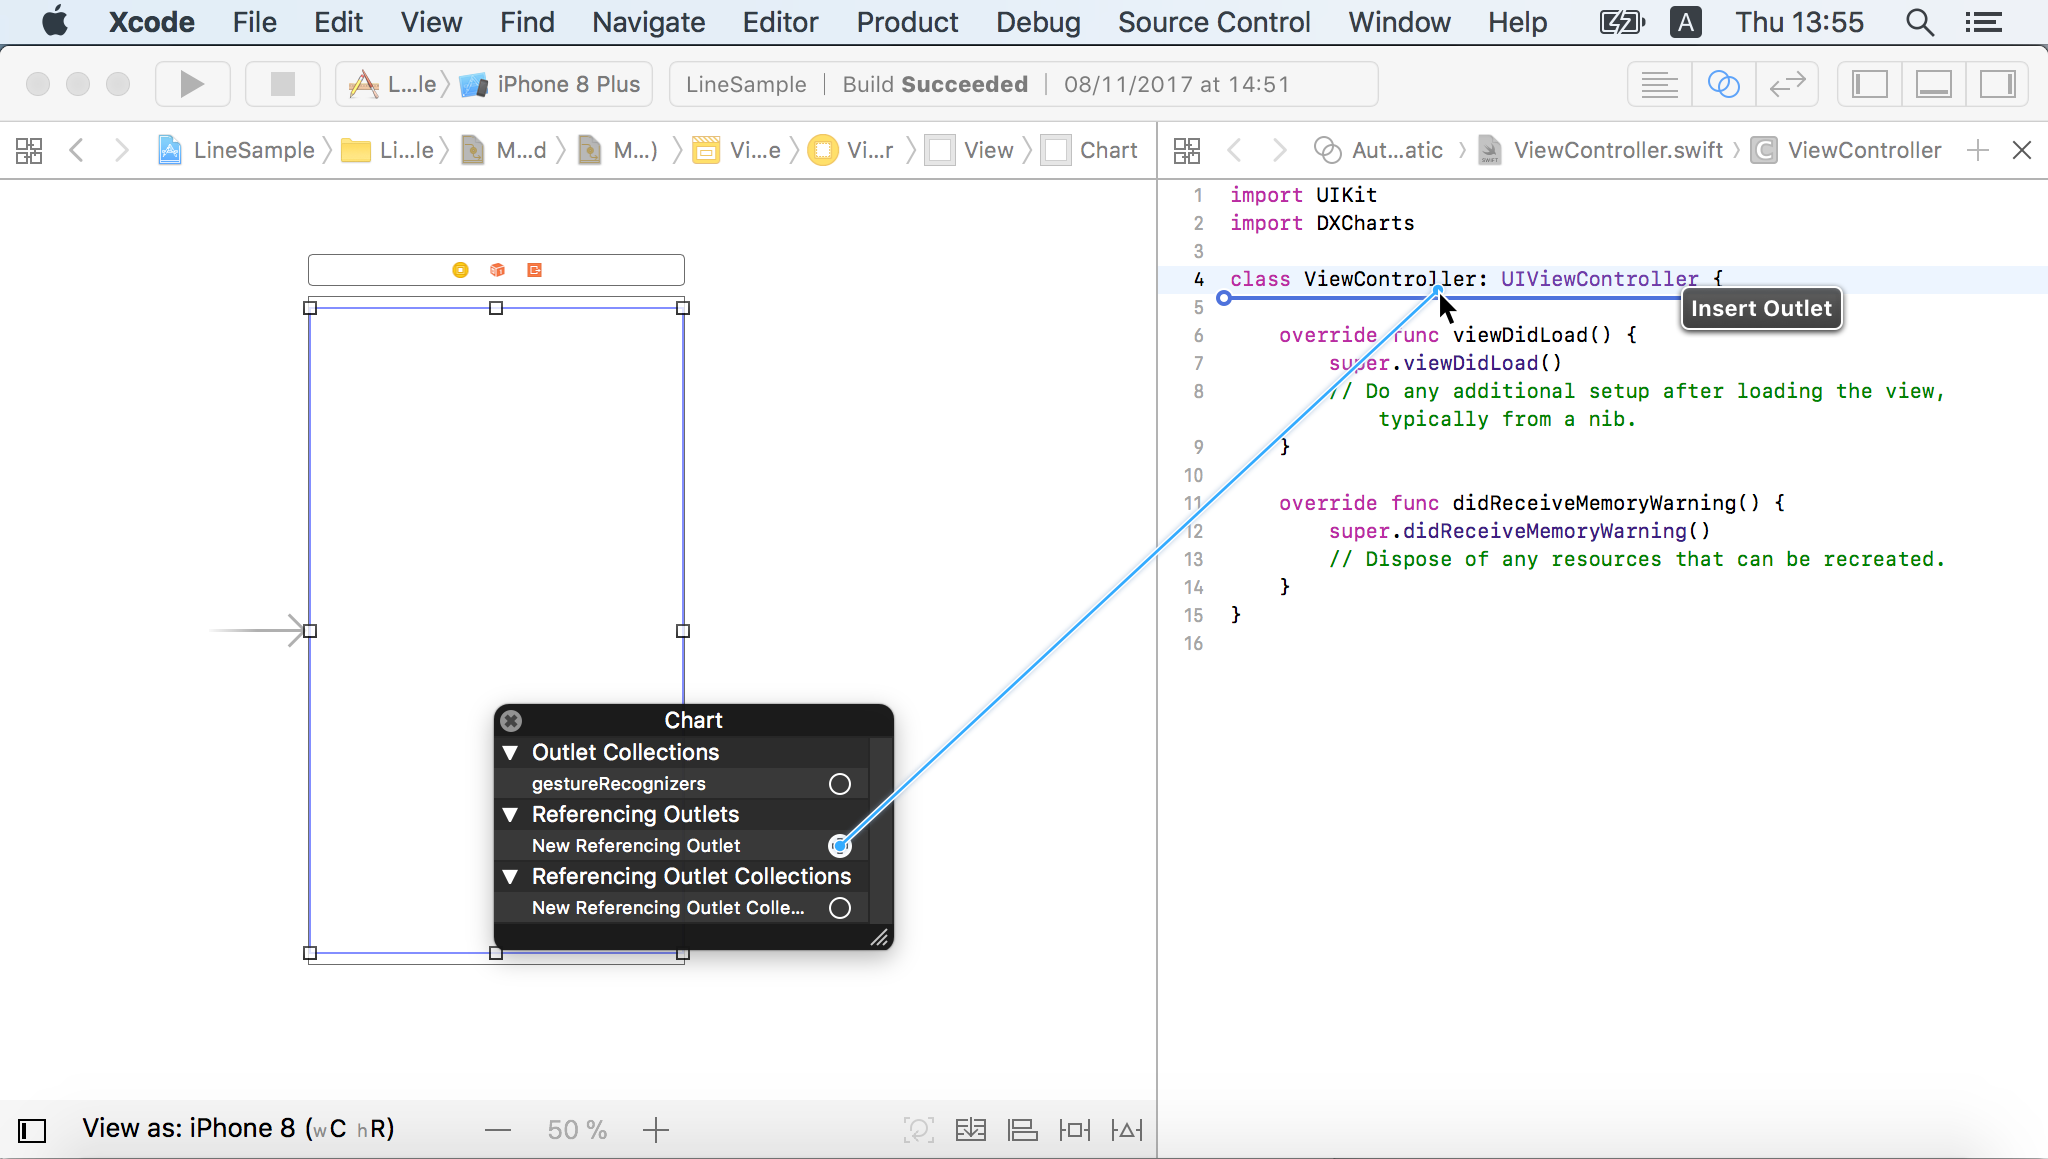
Connect the DXChart view with the view controller using an Outlet. Switch to the Assistant editor and right click the view. Drag-and-drop the New Referencing Outlet item from the invoked menu to the ViewController class declaration.
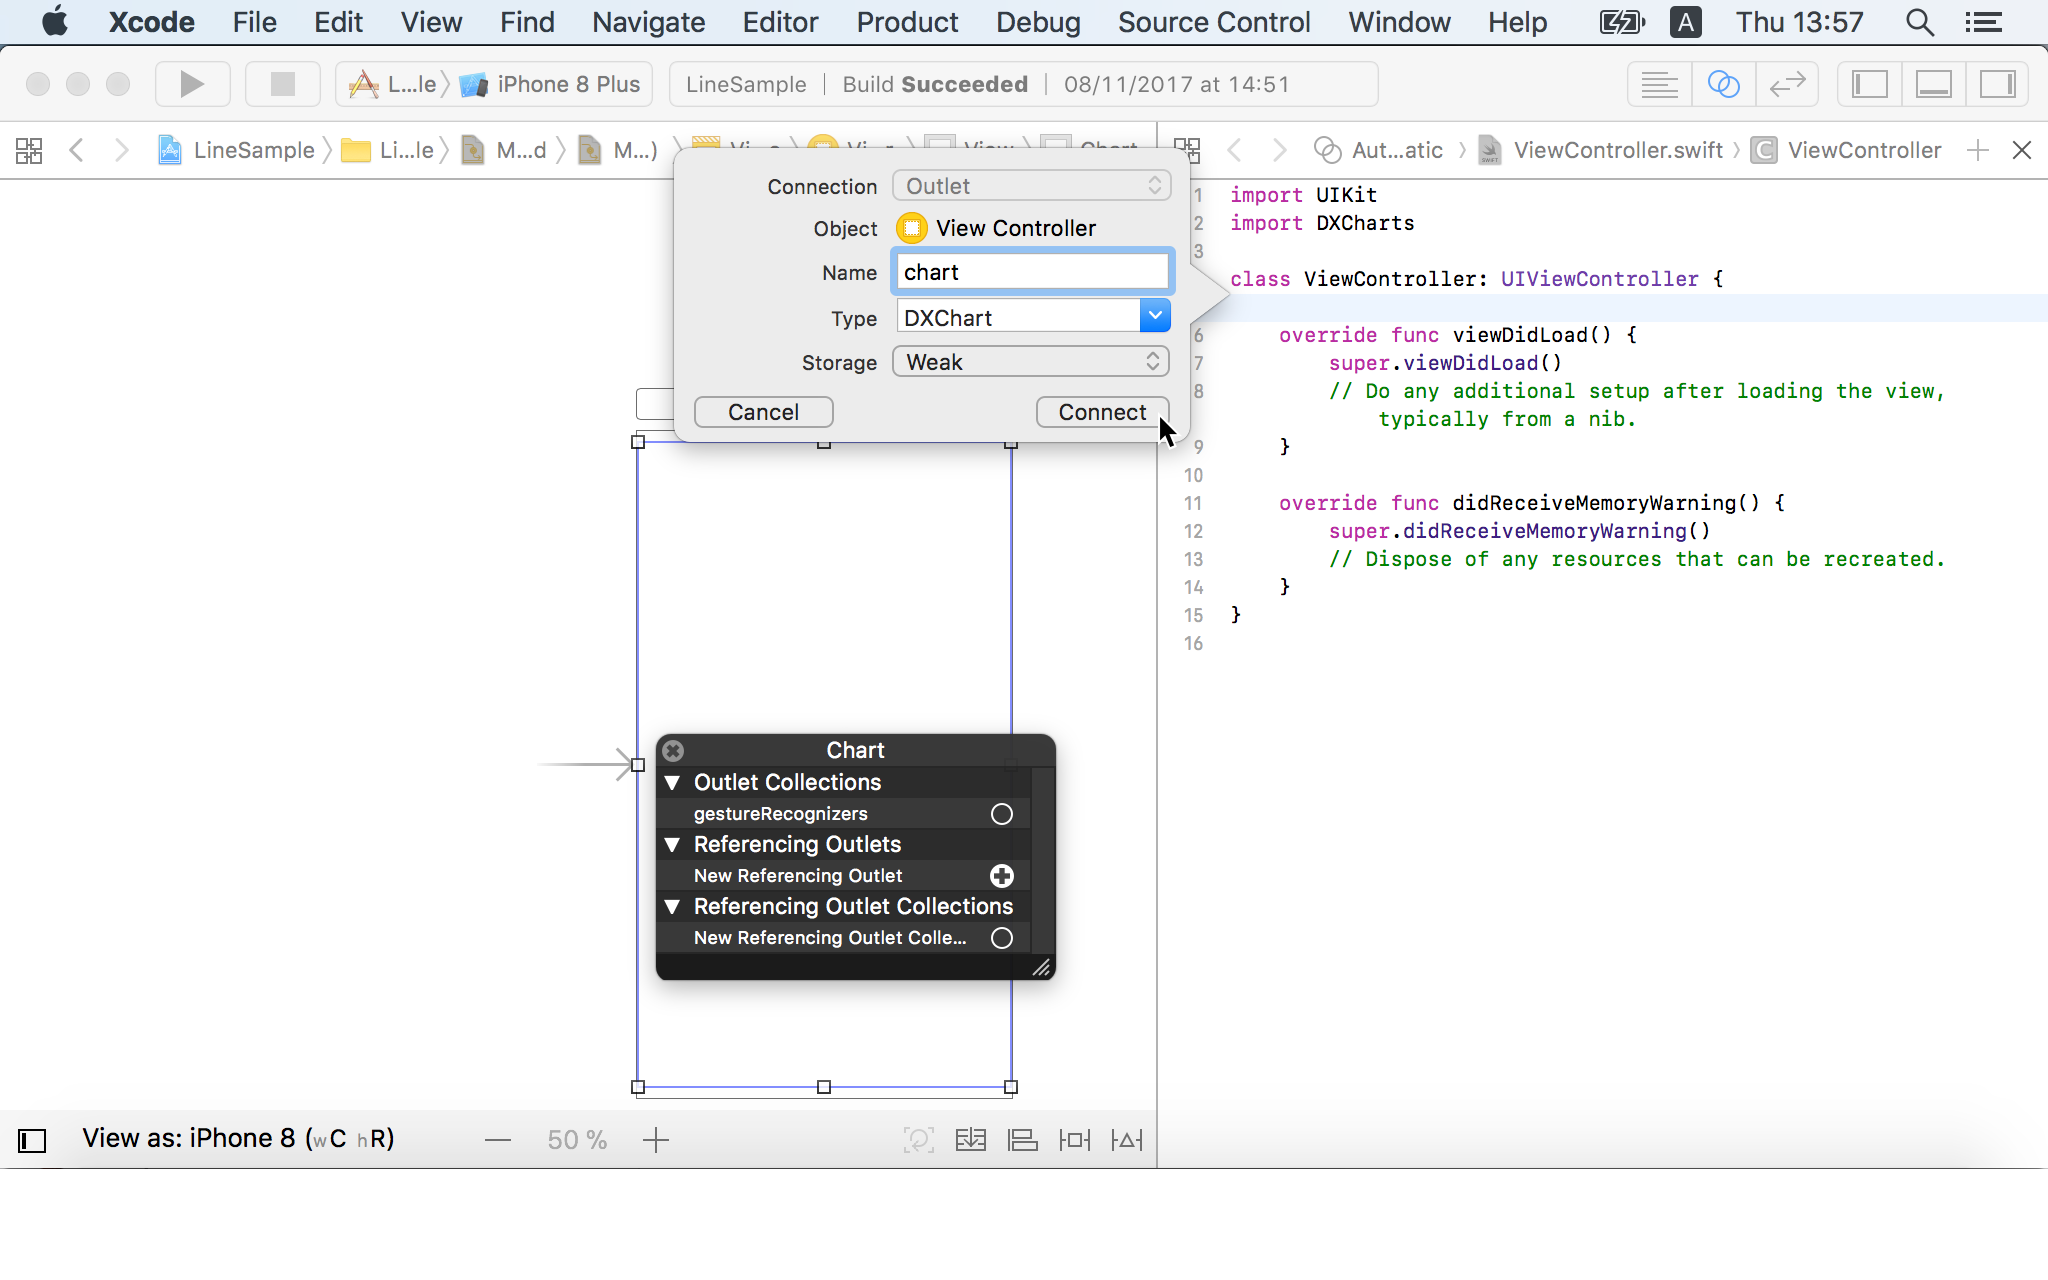
Type the chart name and click Connect in the invoked menu.
Note
You should import the library into the class file for the Chart’s correct work.
#include <DXCharts/DXCHarts.h>
Step 2. Populate a chart with a data
This step populates the DXChart with series.
Create a new class that adopts the DXNumericSeriesData protocol:
@interface GdpData: NSObject<DXNumericSeriesData> +(instancetype) dataWithYears: NSInteger[] years values: double[] values; @end @implementation GdpData { NSArray<NSNumber *> *years; NSArray<NSNumber *> *values; } +(instancetype)dataWithYears:(NSArray<NSNumber *> *)years values: (NSArray<NSNumber *> *)values { GdpData *data = [[GdpData alloc] init]; if (data != nil) { data->years = years; data->values = values; } return data; } -(int) getDataCount { return (int)years.count; } -(double) getArgumentByIndex: (int) index { return [[years objectAtIndex:(NSInteger)index] doubleValue]; } -(double) getValueByIndex: (int) index { return [[values objectAtIndex:(NSInteger)index] doubleValue]; } @endIn the controller’s viewDidLoad method, create a new DXLineSeries instance, and assign a data object with the specified parameters to the data property. Then add a series to the chart:
DXLineSeries *usaSeries = [[DXLineSeries alloc] init]; usaSeries.displayName = @"USA"; usaSeries.data = [GdpData dataWithYears: @[@2015, @2014, @2013, @2012, @2011, @2010, @2009, @2008] values: @[@18.037, @17.393, @16.692, @16.155, @15.518, @14.964, @14.419, @14.719]]; [self.chart addSeries:usaSeries];Add other series to the chart:
DXLineSeries *chinaGdpSeries = [[DXLineSeries alloc] init];
chinaGdpSeries.displayName = @"China";
chinaGdpSeries.data = [GdpData dataWithYears: @[@2015, @2014, @2013, @2012, @2011, @2010, @2009, @2008]
                                      values: @[@11.065, @10.482, @9.607, @8.561, @7.573, @6.101, @5.11, @4.598]];
[self.chart addSeries:chinaGdpSeries];

DXLineSeries *japanGdpSeries = [[DXLineSeries alloc] init];
japanGdpSeries.displayName = @"Japan";
japanGdpSeries.data = [GdpData dataWithYears: @[@2015, @2014, @2013, @2012, @2011, @2010, @2009, @2008]
                                      values: @[@4.383, @4.849, @5.156, @6.203, @6.157, @5.7, @5.231, @5.038]];
[self.chart addSeries:japanGdpSeries];
Step 3. Configure chart axes
In this step, the arguments’ axis is configured to show labels for each argument. The text and position of the values’ axis labels are customized.
Create a new instance of DXNumericAxisX object, configure it, and assign to the DXChart.axisX property:
DXNumericAxisX *axisX = [[DXNumericAxisX alloc] init]; axisX.gridOffset = 0; axisX.gridAlignment = 1; self.chart.axisX = axisX;Note
The X-axis type should be compatible with the series data type. Refer to the Axes guide for more information.
Create a new DXNumericAxisY class instance, configure its labels’ options via the DXAxisBase.label property and a DXAxisLabel object, and assign the axis to the DXChart.axisY property:
DXAxisLabel *axisLabel = [[DXAxisLabel alloc] init];
axisLabel.format = @"$#.# tn";

DXNumericAxisY *axisY = [[DXNumericAxisY alloc] init];
axisY.label = axisLabel;
self.chart.axisY = axisY;
Step 4. Add a legend to the chart
Finally, add a legend to the chart. Create a new DXLegend object, modify its settings, and assign it to the DXChartBase.legend property:
DXLegend *legend = [[DXLegend alloc] init];
legend.horizontalPosition = DXLegendHorizontalPositionCenter;
legend.verticalPosition = DXLegendVerticalPositionTopOutside;
self.chart.legend = legend;
Result
Launch the application to see the results: