Axes
- 8 minutes to read
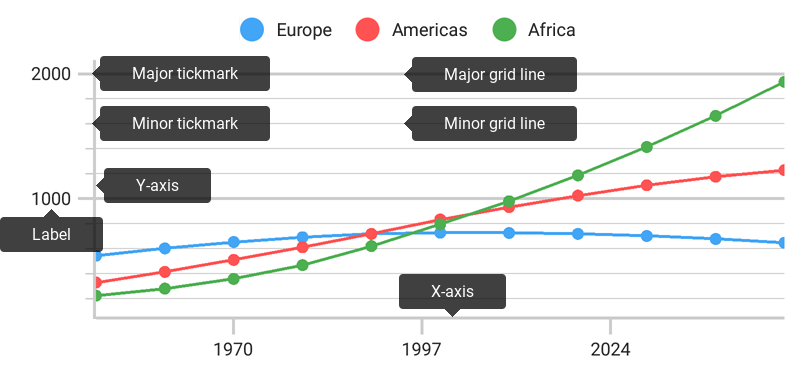
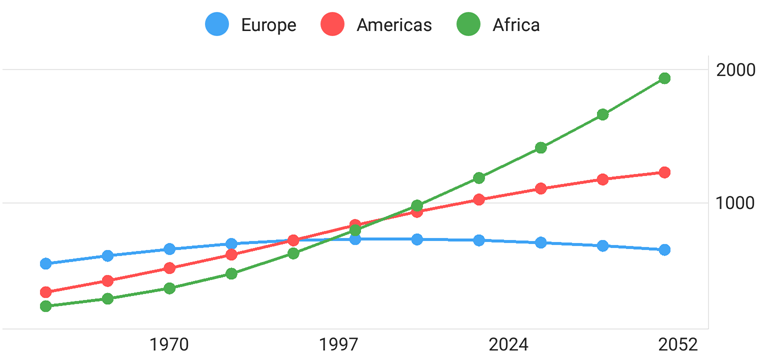
The Cartesian chart uses axes to manage its coordinate space. All series are measured and aggregated using axes. Axes also contain elements that improve a chart’s readability. The following image highlights axes and their elements.
Note
This guide does not contain information about axis structural elements. Refer to the Axes: Elements guide to learn more about axis elements.
How to: Specify chart axes
Axes are created based on the first series’ data type by default. You can specify the type of axis if the default appearance does not meet your requirements.
The following example demonstrates how to specify chart axes:
DateTimeAxisX xAxis = new DateTimeAxisX();
xAxis.setMeasureUnit(DateTimeMeasureUnit.HOUR);
mChart.setAxisX(xAxis);
Note
The X-axis and series data type should be compatible. For example, if the series data implements the NumericSeriesData interface, use the NumericAxisX axis; otherwise, the series data is not visualized.
The following table contains all symbols necessary for axis configuration:
| Symbol | Description |
|---|---|
| QualitativeAxisX | The arguments axis that manages representation of series with QualitativeSeriesData data. |
| NumericAxisX | The arguments axis that manages representation of series with NumericSeriesData data. |
| DateTimeAxisX | The arguments axis that manages representation of series with DateTimeSeriesData or FinancialSeriesData data. |
| NumericAxisY | The values axis that manages representation of series with NumericData data. |
| Chart.getAxisX() | Returns the chart’s X-axis. |
| Chart.getAxisX(AxisX) | Specifies the chart’s X-axis. |
| Chart.getAxisX() | Returns the chart’s Y-axis. |
| Chart.getAxisY(AxisY) | Specifies the chart’s Y-axis. |
How to: Change axis range
The chart automatically calculates the axes’ ranges based on chart series values. Use the following code to specify a custom range:
DateTimeRange range = new DateTimeRange();
range.setMin(new GregorianCalendar(1970, 01, 01).getTime());
range.setMax(new GregorianCalendar(2020, 01, 01).getTime());
range.setVisualMin(new GregorianCalendar(1983, 01, 01).getTime());
range.setVisualMax(new GregorianCalendar(2011, 01, 01).getTime());
xAxis.setRange(range);
The image below demonstrates the result of the code.
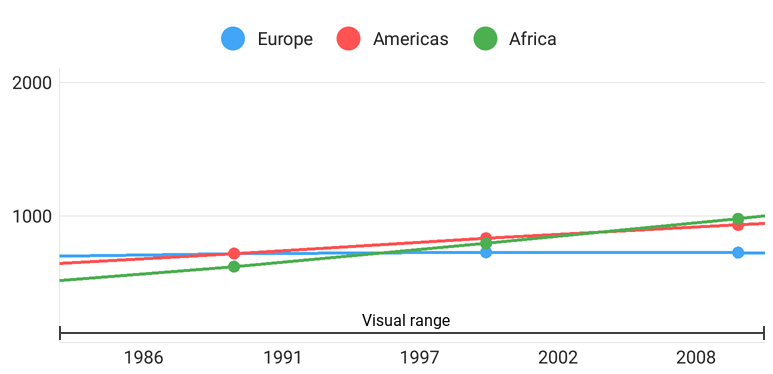
Note that a range consists of a full and visual range. The full range specifies the overall range of data displayed on the Chart while the visual range defines the range of the current chart viewport.
The following table contains the main symbols allowing you to specify ranges. Note that each axis type has its own range type.
| Symbol | Description |
|---|---|
| QualitativeRange | The arguments axis that manages representation of series with QualitativeSeriesData data. |
| NumericRange | The arguments axis that manages representation of series with QualitativeSeriesData data. |
| DateTimeRange | The arguments axis that manages representation of series with QualitativeSeriesData data. |
| QualitativeAxisX.getRange() | Returns the settings that specify axis’s coordinate ranges. |
| QualitativeAxisX.setRange(QualitativeRange) | Specifies the settings that specify axis’s coordinate ranges. |
| QualitativeAxisX.getRange() | Returns the settings that specify axis coordinate ranges. |
| QualitativeAxisX.setRange(NumericRange) | Specifies the settings that specify axis coordinate ranges. |
| QualitativeAxisX.getRange() | Returns the settings that specify axis’s coordinate ranges. |
| QualitativeAxisX.setRange(DateTimeRange) | Specifies the settings that specify ranges of the axis coordinates. |
| QualitativeAxisX.getRange() | Returns the settings that specify axis coordinate ranges. |
| QualitativeAxisX.setRange(NumericRange) | Specifies the settings that specify axis coordinate ranges. |
How to: Calculate a y-axis’s visual range based on an x-axis’s values
A visual y-axis’s range value is calculated based on all x-axis values by default. You can configure the y-axis so its range is calculated based only on visual x-axis values.
The following symbols allow you to configure the visual y-axis range behavior.
| Symbol | Description |
|---|---|
| AutoRangeMode | Lists values that specify how to range visual y-axis values. |
| NumericAxisY.setAutoRangeMode(AutoRangeMode) | Specifies the AutoRangeMode value specifying how the range behaves. |
How to: Customize axis scale parameters
Scale parameters available for customization are dependent on an axis type. The following list groups parameters by axis types.
Qualitative Axis does not have any scale parameter.
Numeric Axis has parameters that the image below represents:
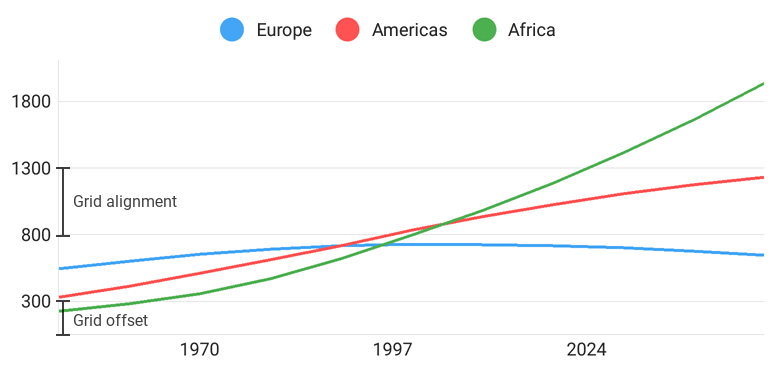
The following code contains example how to customize these parameters.
NumericAxisY yAxis = new NumericAxisY(); // Grid Offset - offset of the first major tickmark and gridline from 0. yAxis.setGridOffset(300.0); // Grid Alignment - distance between two major tickmarks and gridlines. yAxis.setGridAlignment(500.0); mChart.setAxisY(yAxis);The table lists all the symbols allowing you to specify numeric axis scale parameters.
Method Description NumericAxisX.getGridOffset() Returns the first major tickmark’s and gridline’s offset from the range’s minimum value. NumericAxisX.setGridOffset(Double) Specifies the first major tickmark’s and gridline’s offset from the range’s minimum value. NumericAxisX.getGridAlignment() Returns the grid’s alignment. NumericAxisX.setGridAlignment(Double) Specifies the grid’s alignment. NumericAxisY.getGridOffset() Return the first major tickmark’s and gridline’s offset from the range’s minimum value. NumericAxisY.setGridOffset(Double) Specifies the first major tickmark’s and gridline’s offset from the range’s minimum value. NumericAxisY.getGridAlignment() Returns the grid’s alignment. NumericAxisY.setGridAlignment(Double) Specifies the grid’s alignment. Date-Time Axis contains scale parameters shown in the following image.
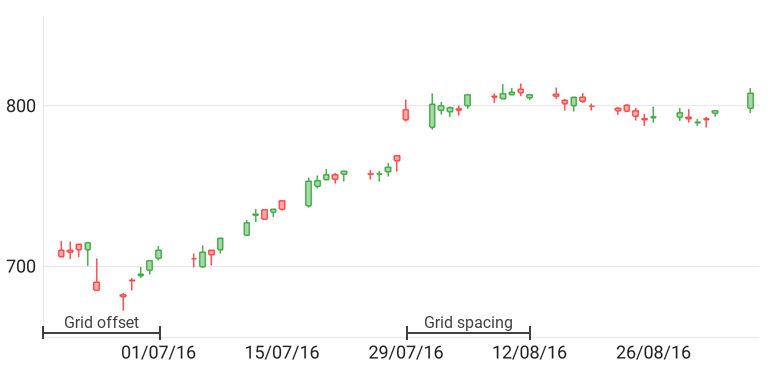
The code below demonstrates how to configure these parameters.
DateTimeAxisX xAxis = new DateTimeAxisX(); // If series data provides more detailed data than the measurement unit, for example, by hours, xAxis.setMeasureUnit(DateTimeMeasureUnit.DAY); // data is aggregated using a function specified by this aggregation type. xAxis.setAggregationType(AggregationType.AVG); // Unit used to align the grid may be different to the measurement unit. // It should be less detailed. xAxis.setGridAlignment(DateTimeMeasureUnit.WEEK); // The Offset and Spacing are in alignment units. // Grid Offset - specifies how many units are skipped before // the first major tickmark and gridline. xAxis.setGridOffset(1); // Grid Spacing - distance between two major tickmarks and gridlines, in units. xAxis.setGridSpacing(2); mChart.setAxisX(xAxis);The table lists all symbols allowing you to specify scale parameters of a numeric axis.
Symbol Description DateTimeAxisX.getMeasureUnit() Returns the axis’s measurement unit. DateTimeAxisX.setMeasureUnit(DateTimeMeasureUnit) Specifies the axis’s measurement unit. DateTimeAxisX.getAggregationType() Returns the aggregation function type. DateTimeAxisX.setAggregationType(AggregationType) Specifies the aggregation function type. DateTimeAxisX.getGridAlignment() Return the measurement unit by which the chart grid is aligned. DateTimeAxisX.setGridAlignment(DateTimeMeasureUnit) Specifies the measurement unit by which grid is aligned. DateTimeAxisX.getGridOffset() Returns the first major tickmark’s and gridline’s initial offset from the range’s minimum value. DateTimeAxisX.setGridOffset(Integer) Specifies the first major tickmark’s and gridline’s initial offset from the range’s minimum value. DateTimeAxisX.getGridSpacing() Returns the distance between two major tickmarks and gridlines. DateTimeAxisX.setGridSpacing(Integer) Specifies the distance between two major tickmarks and gridlines.
How to: Change an axis position
You can relocate an axis within a chart.
The following code demonstrates how to position the values axis at the right of a chart.
NumericAxisY axisY = new NumericAxisY();
axisY.setPosition(AxisPosition.FAR);
chart.setAxisY(axisY);
The following table lists the symbols that allow you to define an axis position.
| Symbol | Description |
|---|---|
| AxisBase.setPosition(AxisPosition) | Specifies the axis position. |
| AxisPosition | Lists the values indicating available axis positions. |
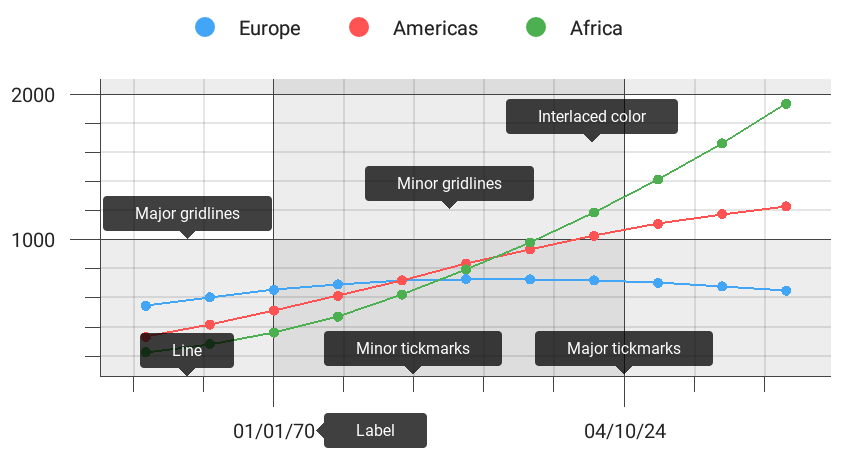
How to: Configure appearance of axis elements
The following image represents axis elements whose appearance can be changed:
Use the code below to modify axis elements appearance:
TextStyle textStyle = new TextStyle();
AxisLabelStyle labelStyle = new AxisLabelStyle();
AxisLabel label = new AxisLabel();

textStyle.setSize(20.0f);
textStyle.setPaintFlags(Paint.ANTI_ALIAS_FLAG);
labelStyle.setTextStyle(textStyle);
label.setStyle(labelStyle);

xAxis.setLabel(label);
yAxis.setLabel(label);

AxisStyle axisStyle = new AxisStyle();
axisStyle.setLineVisible(true);
axisStyle.setMajorGridlinesVisible(true);
axisStyle.setMinorGridlinesVisible(true);
axisStyle.setMajorTickmarksVisible(true);
axisStyle.setMinorTickmarksVisible(true);

axisStyle.setLineColor(Color.DKGRAY);
axisStyle.setLineThickness(1.0f);
axisStyle.setMajorGridlinesColor(Color.DKGRAY);
axisStyle.setMajorGridlinesThickness(1.0f);
axisStyle.setMajorTickmarksThickness(1.0f);
axisStyle.setMinorTickmarksThickness(1.0f);

axisStyle.setInterlacedColor(0x20707070);
axisStyle.setInterlacedVisible(true);

xAxis.setStyle(axisStyle);
yAxis.setStyle(axisStyle);
The code above uses the following symbols:
| Symbol | Description |
|---|---|
| AxisBase.getStyle() | Returns the axis style. |
| AxisBase.setStyle(AxisStyle) | Returns the axis style. |
| AxisStyle | Specifies the chart axis appearance. |
| AxisLabelBase.getStyle() | Returns an axis label’s appearance settings. |
| AxisLabelBase.setStyle(AxisLabelStyle) | Specifies an axis label’s appearance settings. |
| AxisLabelStyle | The axis labels appearance options’ storage. |