Pie Chart
- 3 minutes to read
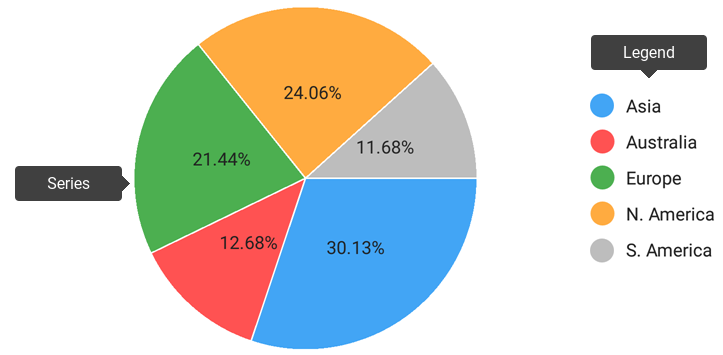
The DevExpress PieChart allows you to visualize your data in a Pie (Circular) chart. The image below represents a Pie chart and highlights its major elements.
This guide contains the descriptions of specific operations that can be performed with the PieChart.
How to: Modify chart series
The Chart visualizes data the series provides. Each series defines data appearance and behavior. Series, compatible with the Pie chart inherit the PieSeries class.
Note
Note that chart should be populated with data. Refer to the Series guide for more information.
The following code shows how to add a series to a chart:
PieDataAdapter adapter = new PieDataAdapter();
adapter.add("Asia", 30.13);
adapter.add("Australia", 12.68);
adapter.add("Europe", 21.44);
adapter.add("N. America", 24.06);
adapter.add("S. America", 11.68);

PieSeries pieSeries = new PieSeries();
pieSeries.setDisplayName("Sales Comparison");
pieSeries.setData(adapter);

mChart.addSeries(pieSeries);

// ...
public class PieDataAdapter implements PieSeriesData {
    private List<String> arguments;
    private List<Double> values;

    public PieDataAdapter() {
        arguments = new ArrayList<>();
        values = new ArrayList<>();
    }
    public void add(String arg, Double val) {
        arguments.add(arg);
        values.add(val);
    }
    public int getDataCount() { return arguments.size(); }
    public String getLabel(int index) { return arguments.get(index); }
    public double getValue(int index) { return values.get(index); }
}
The following table contains methods allowing you to obtain, add or remove series of the chart:
| Method | Description |
|---|---|
| PieChart.getSeries() | Returns the array of series that the chart displays. |
| PieChart.addSeries(PieSeries) | Adds the specified new series to the chart. |
| PieChart.removeSeries(PieSeries) | Removes the specified series from the chart. |
| PieChart.removeSeries(int) | Removes a series at the specified index from the chart. |
How to: Configure a chart legend
The Legend identifies series in a chart. The following example demonstrates the basic legend configuration:
Legend legend = new Legend();
legend.setOrientation(LegendOrientation.LEFT_TO_RIGHT);
legend.setHorizontalPosition(LegendHorizontalPosition.CENTER);
legend.setVerticalPosition(LegendVerticalPosition.TOP_OUTSIDE);
legend.setVisible(true);
pieChart.setLegend(legend);
The table below contains the main methods for configuring the legend:
| Method | Description |
|---|---|
| ChartBase.getLegend() | Returns the chart legend‘s options. |
| ChartBase.setLegend(Legend) | Specifies the chart legend‘s options. |
| Legend | The legend of the chart. |
Refer to the Legend guide for more information about legend configuration.
How to: Change chart appearance
Appearance of all chart elements including the Pie Chart can be changed using styles. The following image demonstrates which chart parameters can be styled:
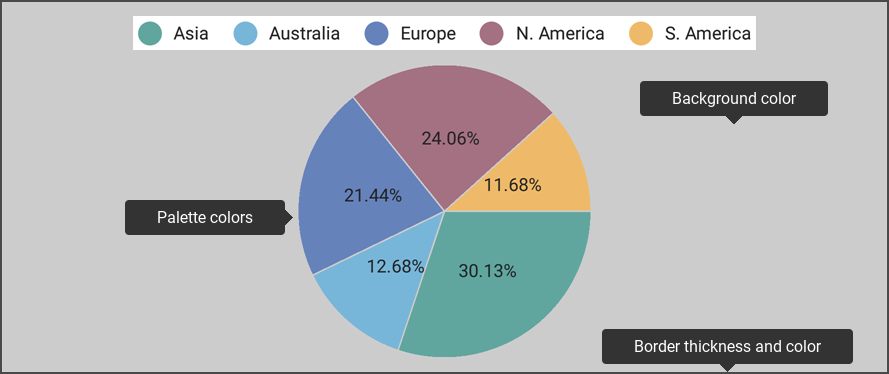
The following code snippet demonstrates how to obtain the image above:
PieChartStyle pieChartStyle = new PieChartStyle();
pieChartStyle.setBorderColor(Color.DKGRAY);
pieChartStyle.setBorderThickness(2.0f);
pieChartStyle.setBackgroundColor(Color.LTGRAY);
pieChartStyle.setPalette(new int[] {0xff60a69f, 0xff78b6d9, 0xff6682bb, 0xffa37182, 0xffeeba69});
pieChart.setStyle(pieChartStyle);
The following symbols allow you to configure chart style:
| Symbol | Description |
|---|---|
| PieChart.getStyle() | Returns the Pie chart’s style. |
| PieChart.setStyle(PieChartStyle) | Specifies the Pie chart’s style. |
| PieChartStyle | The Pie chart appearance settings storage. |