Cartesian Series
- 3 minutes to read
The DevExpress Chart provides a variety of 2D series types that allow you to display data as a basic chart or a combination of various series views:
The following groups separate all available series:
Common Series
This group contains the basic chart series that render data as a collection of points.
| Type | Preview | Description |
|---|---|---|
| AreaSeries | 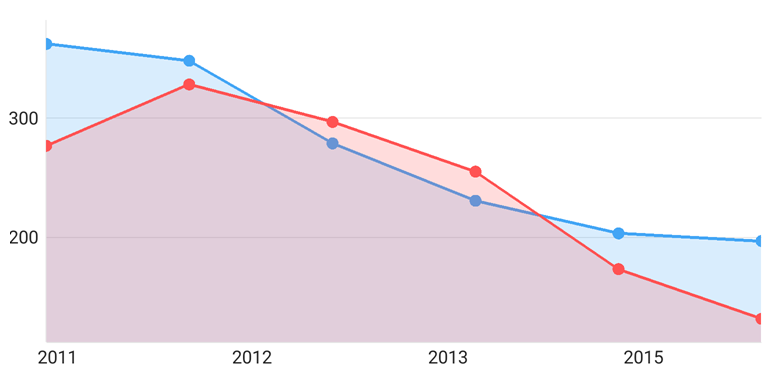 |
Displays data as filled areas on a chart. Each data point is a peak or hollow in the area. |
| StackedAreaSeries | 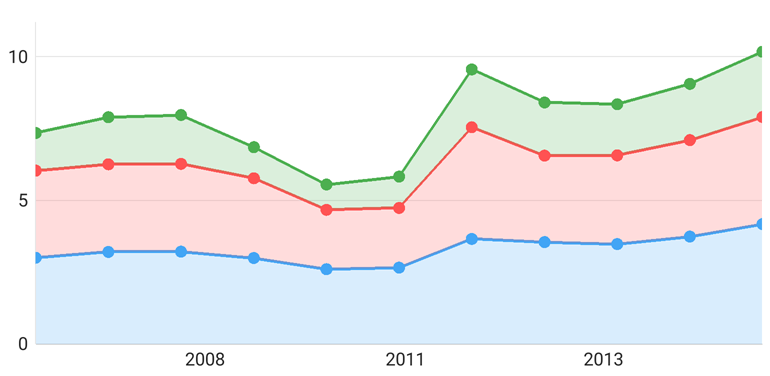 |
Displays data as filled areas on a chart. Each data point’s value is aggregated with the underlying data points’ values. |
| FullStackedAreaSeries | 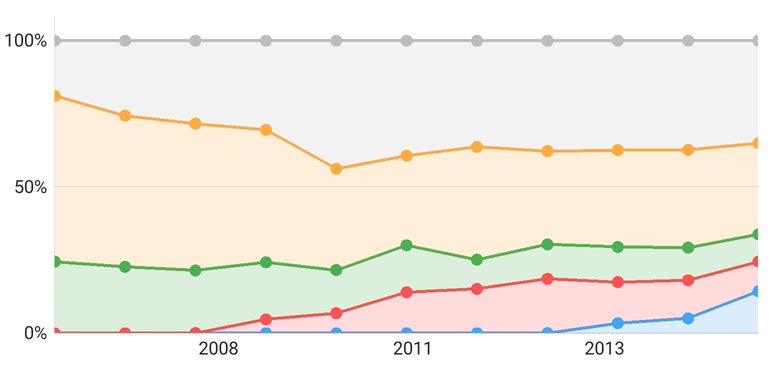 |
Displays data as filled areas on a chart. Each data point’s value is aggregated with the underlying data points’ values and normalized to completely fill the plot area’s height. |
| StepAreaSeries | 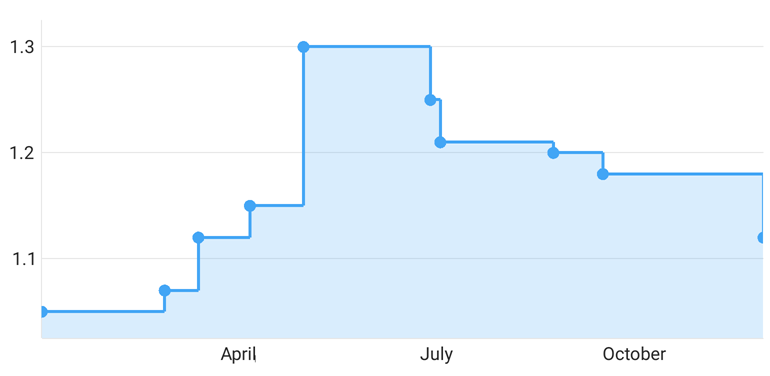 |
Displays data as filled areas which horizontal and vertical lines that connect data points form. |
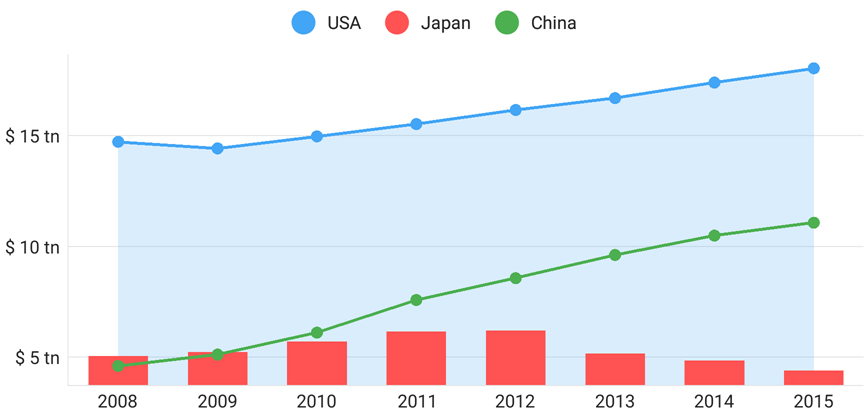
| BarSeries | 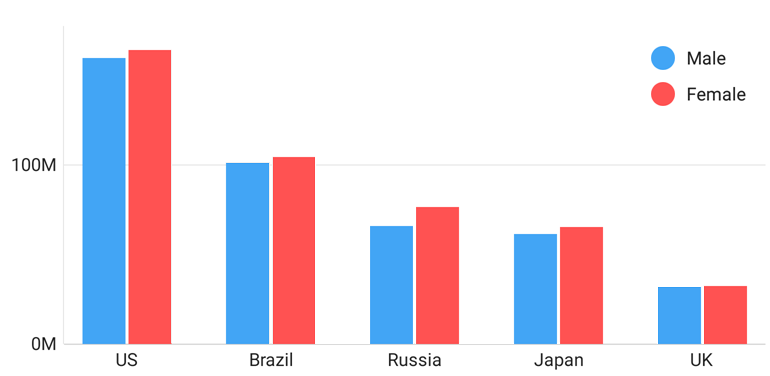 |
Displays data as individual bars, grouped by arguments, whose values determine bars’ height. |
| StackedBarSeries | 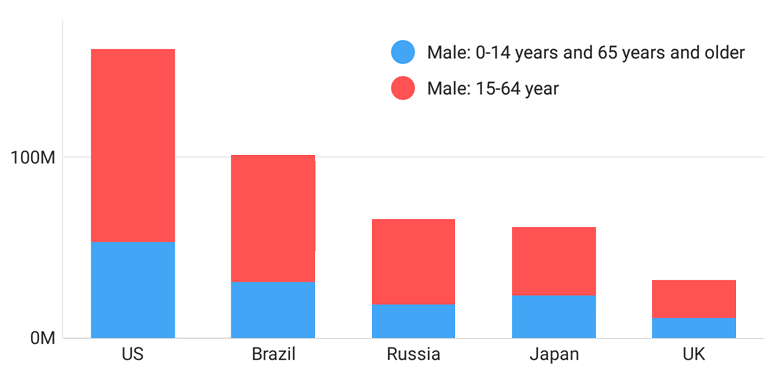 |
Displays data as individual bars, stacked by arguments, whose values determine bars’ height. |
| FullStackedBarSeries | 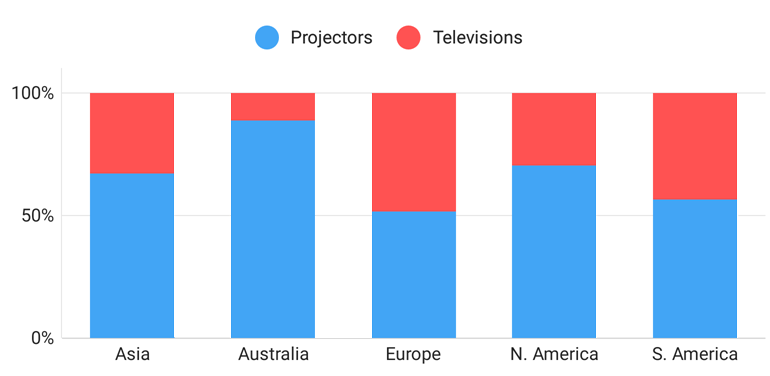 |
Displays data as individual bars, stacked by arguments, in such way that stacked bars completely fill plot area’s height. |
| SideBySideStackedBarSeries | 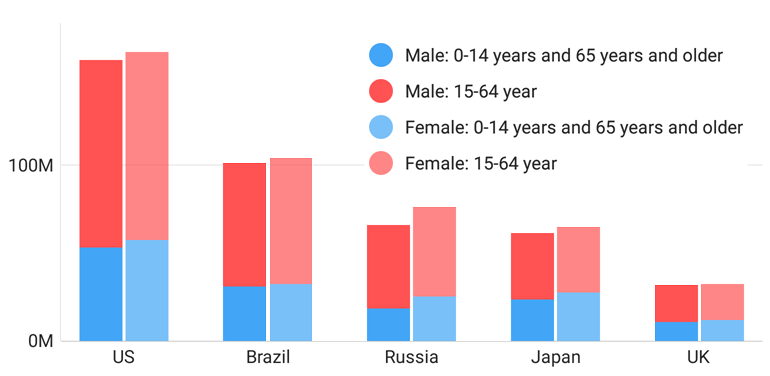 |
This series combines the advantages of both the Stacked Bar and Bar series, and allows you to stack different bars, and combine stacks into groups shown side-by-side across the same argument. |
| SideBySideFullStackedBarSeries | 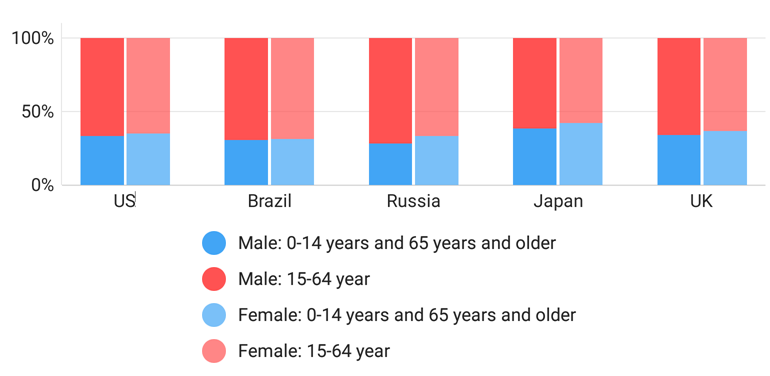 |
Displays data as individual bars, stacked and grouped by arguments, and normalized to completely fill plot area height. |
| PointSeries | 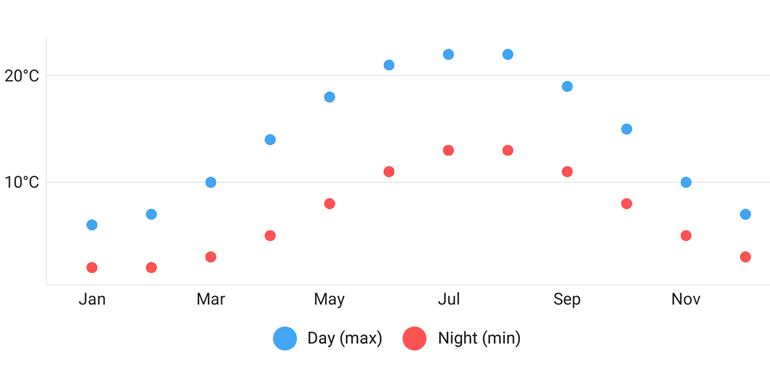 |
Displays data as a collection of scatter points. |
| LineSeries | 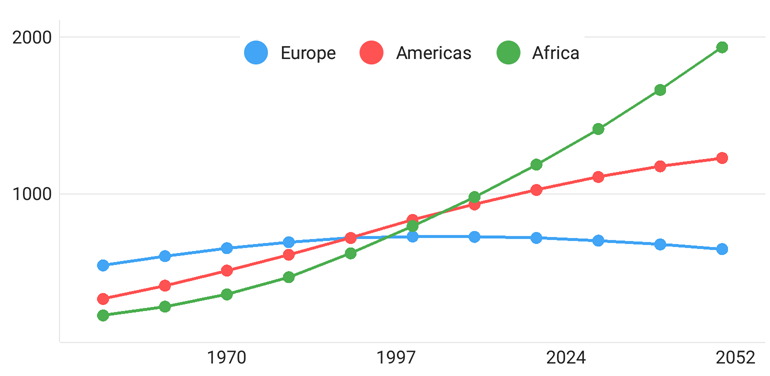 |
Displays data as points which a line connects. |
| StepLineSeries | 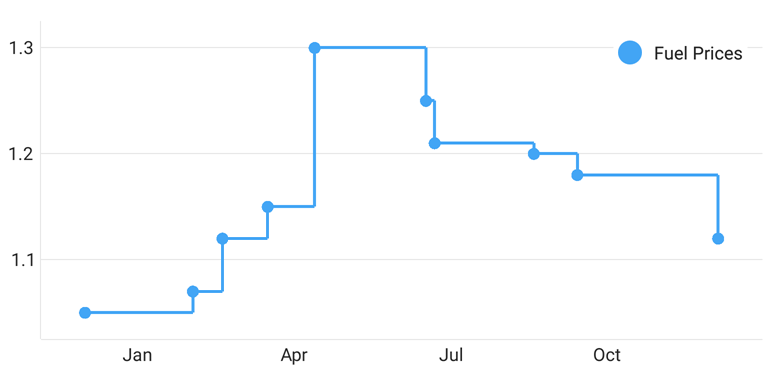 |
Displays data as points which horizontal and vertical lines connect. |
| ScatterLineSeries | 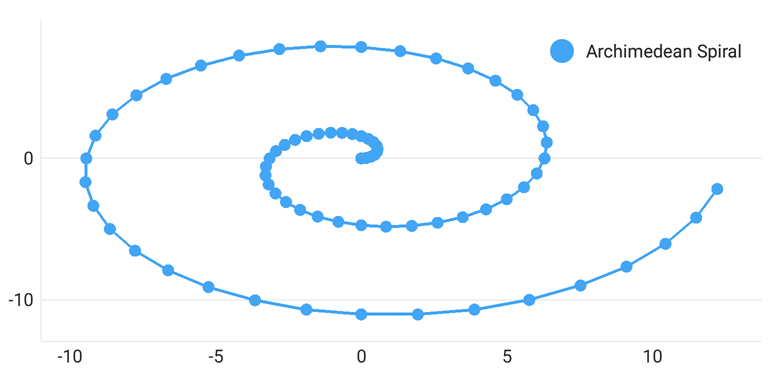 |
This series displays data points connected in the same order as they were indexed. That is, in contrast to the Line series, that sorts data points by the argument. |
Three Dimensional Series
This group contains series that displays additional data using a specific form.
| Type | Preview | Description |
|---|---|---|
| BubbleSeries | 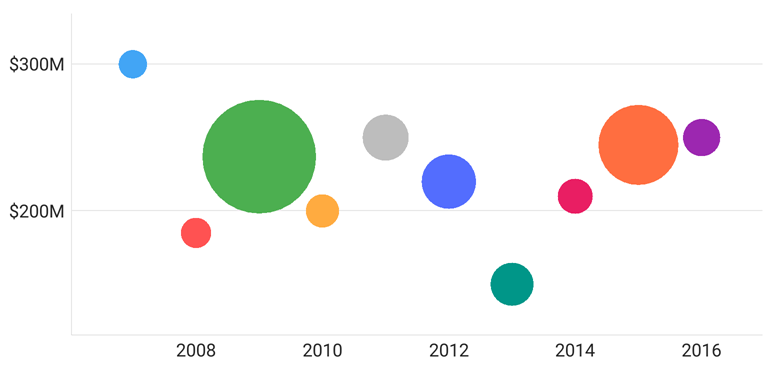 |
Visualizes three-dimensional data. A bubble position displays two dimensions, and a bubble’s size is the third dimension. |
Financial Series
Financial (or Low-High-Open-Close) series are useful for the stock price, bond price, and commodities behavior analysis. The below table lists all available financial series.
| Type | Preview | Description |
|---|---|---|
| StockSeries | 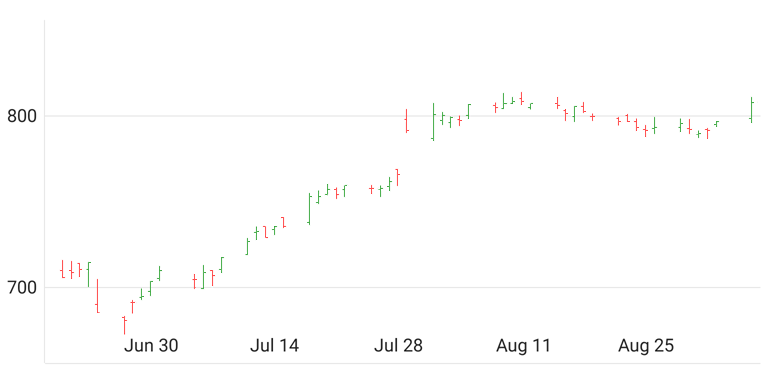 |
The bottom and top values of the vertical line, shown at each point, represent the Low and High values, the left tick mark represents the Open value and the right one - Close value. |
| CandleStickSeries | 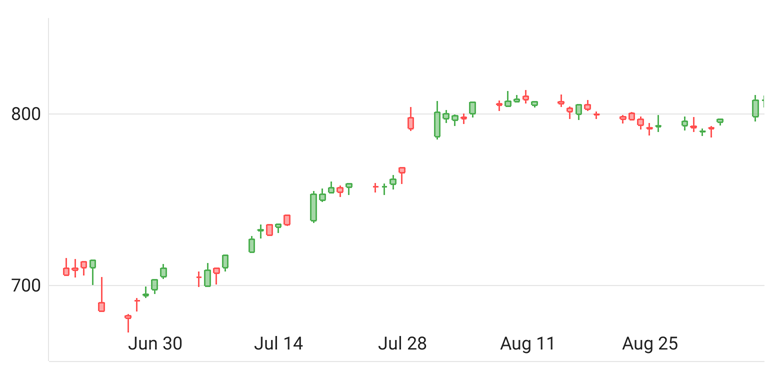 |
Each point consists of a rectangle (the Open and Close values specify the body) and a vertical line (the Low and High values specify the tail). The body is green if the stock closes higher than its opening price. Otherwise, the body is red. |