Series
- 4 minutes to read
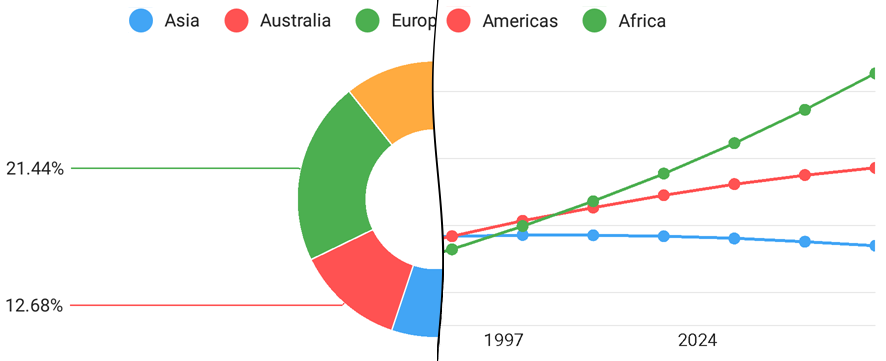
The Series manages data and its appearance on the chart. The following image represents several series on charts:
Note that, a chart’s series should be compatible with the chart type. Refer to the Pie Series and Cartesian Series guides for more information.
How to: Provide series data
All series interact with their data sources using Data interfaces. The following code snippets demonstrate how to implement one of them:
class GdpData implements NumericSeriesData {
    private List<Gdp> gdps = new ArrayList<>();

    public  GdpData(Gdp... points) { for (Gdp point : points) gdps.add(point); }

    @Override
    public int getDataCount() { return gdps.size(); }

    @Override
    public double getArgument(int i) { return gdps.get(i).getYear(); }

    @Override
    public double getValue(int i) { return gdps.get(i).getProduct(); }
}

// ...
Series line = new LineSeries();
line.setData(new GdpData(gdps));
mChart.addSeries(line);
// ...
Note
The series Data source type should be compatible with the axis type in the cartesian chart; otherwise series is not plotted on the chart. Refer to the Data guide to learn more.
The table below represents all symbols required to specify data.
| Symbol | Description |
|---|---|
| PieSeries.getData() | Returns the Pie series‘s data. |
| PieSeries.setData(PieSeriesData) | Specifies the Pie series‘s data. |
| PieSeriesData | The interface that should be implemented by the data adapter providing data for pie series. |
| Series.getData() | Returns the Cartesian series‘s data. |
| Series.setData(XYSeriesData) | Specifies the Cartesian series‘s data. |
| QualitativeSeriesData | The interface of a data source providing points for a Cartesian series, with a qualitative argument and a single numeric value. |
| WeightedQualitativeSeriesData | The interface of a data source providing the Bubble series points that have qualitative arguments. |
| NumericSeriesData | The interface of a data source providing points for a Cartesian series, with a numeric argument and a single numeric value. |
| WeightedNumericSeriesData | The interface of a data source providing the Bubble series points that have numeric arguments. |
| DateTimeSeriesData | The interface which a class that provides data points with date-time arguments should implement. |
| WeightedDateTimeSeriesData | The interface of a data source providing the Bubble series points that have date-time arguments. |
| FinancialSeriesData | A class that provides financial data points should implement this interface. |
How to: Configure series point labels
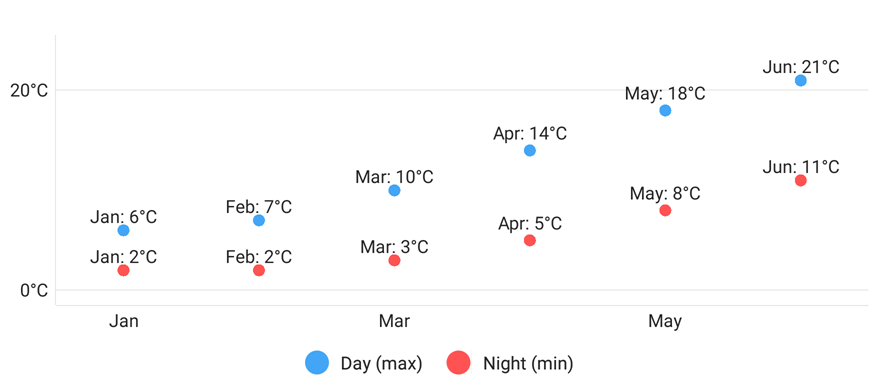
Labels can accompany series points. Note that different series types have different label settings. The image below demonstrates a Line series’s customized point labels.
The following code snippet demonstrates how to configure a Point series point labels:
MarkerSeriesLabel label = new MarkerSeriesLabel();
label.setTextPattern("{A$tb}: {V$.0f}°C");
label.setVisible(true);
series.setLabel(label);
MarkerSeriesLabel label = new MarkerSeriesLabel();
label.SetVisible(new Java.Lang.Boolean(true));
label.TextPattern = "{A$tb}: {V$.0f}°C";
series.Label = label;
Use the setLabel method to define the settings that specifies the contents, position and appearance of series point labels.
In the code above, series label placeholders (A and V) specify a series point value that should be added to the label. The following label placeholders are available:
| Placeholder | Description |
|---|---|
| {S} | Displays a series name. |
| {A} | Displays a series point argument. |
| {L} | Displays a pie series point label. |
| {V} | Displays a series point value. |
| {VP} | Displays a series point value as percentages. |
| {W} | Displays a Bubble series point weight. |
| {O} | Displays a financial series point open value. |
| {H} | Displays a financial series point high value. |
| {L} | Displays a financial series point low value. |
| {C} | Displays a financial series point close value. |
Note
These values can be formatted using default format strings after the $ sign.
For example, in the {VP$#.##} string, VP is a placeholder, $ is a format string separator, and #.## is a format string.
How to: Customize appearance of series
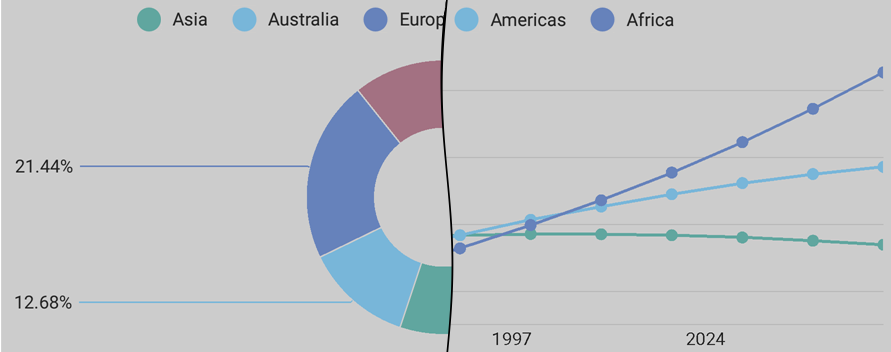
A series’ appearance parameters depend on the series type. The following image demonstrates customizable appearance parameters:
Each series has style parameters, available using the getStyle, setStyle methods. Refer to the required series type reference for more information.