DashboardItemMouseActionEventArgs Class
Provides data for events related to mouse actions.
Namespace: DevExpress.DashboardWin
Assembly: DevExpress.Dashboard.v25.2.Win.dll
NuGet Package: DevExpress.Win.Dashboard
Declaration
Remarks
The DashboardItemMouseActionEventArgs class provides data for events listed in the following table:
| Event | Description |
|---|---|
| DashboardViewer.DashboardItemClick | Occurs when an end user clicks a dashboard item. |
| DashboardViewer.DashboardItemDoubleClick | Occurs when an end user double-clicks a dashboard item. |
| DashboardViewer.DashboardItemMouseDown | Occurs when the mouse pointer is over the dashboard item and a mouse button is pressed. |
| DashboardViewer.DashboardItemMouseMove | Occurs when the mouse pointer is moved over the dashboard item. |
| DashboardViewer.DashboardItemMouseUp | Occurs when the mouse pointer is over the dashboard item and a mouse button is released. |
| DashboardDesigner.DashboardItemClick | Occurs when an end-user clicks a dashboard item. |
| DashboardDesigner.DashboardItemDoubleClick | Occurs when an end-user double-clicks a dashboard item. |
| DashboardDesigner.DashboardItemMouseDown | Occurs when the mouse pointer is over the dashboard item and a mouse button is pressed. |
| DashboardDesigner.DashboardItemMouseMove | Occurs when the mouse pointer is moved over the dashboard item. |
| DashboardDesigner.DashboardItemMouseUp | Occurs when the mouse pointer is over the dashboard item and a mouse button is released. |
Use the DashboardItemMouseEventArgs.DashboardItemName property to obtain the dashboard item name for which the event has been raised. The DashboardItemMouseHitTestEventArgs.Data property returns the client data for this dashboard item.
The DashboardItemMouseHitTestEventArgs.GetAxisPoint method returns the axis point related to the clicked dashboard item element. To obtain the underlying data for this element, use the DashboardItemMouseHitTestEventArgs.GetUnderlyingData method.
Example
The following example demonstrates how to obtain client data corresponding to a particular visual element using DashboardViewer‘s API.
In this example, the DashboardViewer.DashboardItemClick event is handled to obtain client data for the Card dashboard item and display this data in a Chart control.
When a user clicks a card, the app obtains axis points placed on the “Sparkline” axis, determines corresponding actual/target values, and saves these values to a data table. This table is used as a data source for the Chart control.
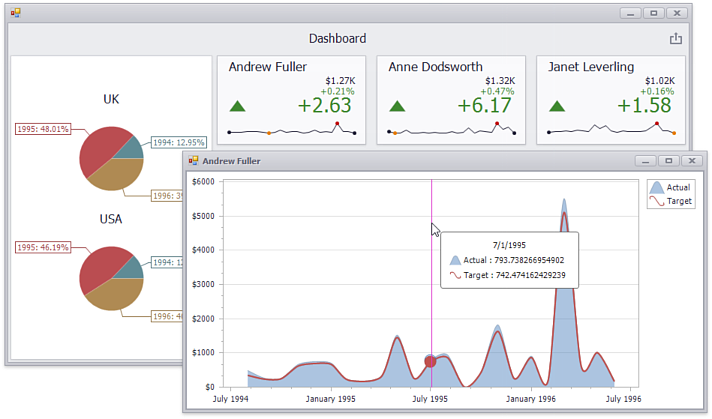
The Pie dashboard item demonstrates the master filtering feature. Click the slice and the Cards will display client data by the selected year.
using System;
using System.Data;
using System.Drawing;
using System.Windows.Forms;
using DevExpress.XtraEditors;
using DevExpress.DashboardWin;
using DevExpress.DashboardCommon;
using DevExpress.XtraCharts;
using DevExpress.DashboardCommon.ViewerData;

namespace Dashboard_ClientDataCards_Win {
    public partial class Form1 : XtraForm {
        public Form1() {
            InitializeComponent();
            dashboardViewer1.DashboardItemClick += dashboardViewer1_DashboardItemClick;
        }

        // Handles the DashboardViewer.DashboardItemClick event.
        private void dashboardViewer1_DashboardItemClick(object sender,
            DashboardItemMouseActionEventArgs e) {
            if (e.DashboardItemName == "cardDashboardItem1" & e.GetAxisPoint() != null) {
                // Obtains client data related to the clicked card.
                MultiDimensionalData clickedItemData = e.Data.GetSlice(e.GetAxisPoint());
                DeltaDescriptor delta = e.GetDeltas()[0];

                // Creates a data table that will be used to hold client data.
                DataTable dataSource = new DataTable();
                dataSource.Columns.Add("Argument", typeof(DateTime));
                dataSource.Columns.Add("Actual", typeof(double));
                dataSource.Columns.Add("Target", typeof(double));

                // Saves values of axis points placed on the "sparkline" axis and corresponding
                // actual/target values to the data table.
                foreach (AxisPoint point in
                    clickedItemData.GetAxisPoints(DashboardDataAxisNames.SparklineAxis)) {
                        DataRow row = dataSource.NewRow();
                        DeltaValue deltaValue = clickedItemData.GetSlice(point).GetDeltaValue(delta);
                        if (deltaValue.ActualValue.Value != null &&
                            deltaValue.TargetValue.Value != null) {
                            row["Argument"] = point.Value;
                            row["Actual"] = deltaValue.ActualValue.Value;
                            row["Target"] = deltaValue.TargetValue.Value;
                        }
                        else {
                            row["Argument"] = DBNull.Value;
                            row["Actual"] = DBNull.Value;
                            row["Target"] = DBNull.Value;
                        }
                        dataSource.Rows.Add(row);
                }
                DisplayDetailedChart(GetFormTitle(clickedItemData), dataSource);
            }
        }

        // Creates a new form that is invoked on the card click and
        // shows the chart displaying client data.
        void DisplayDetailedChart(string title, DataTable dataSource) {
            XtraForm form = new XtraForm();
            form.Text = title;
            form.Bounds = new Rectangle(100, 100, 700, 350);

            ChartControl chart = new ChartControl();
            chart.Parent = form; chart.Dock = DockStyle.Fill;

            Series series1 = new Series("Actual", ViewType.SplineArea);
            Series series2 = new Series("Target", ViewType.Spline);
            chart.Series.AddRange(new Series[] { series1, series2 });

            foreach (Series series in chart.Series) {
                series.DataSource = dataSource; series.ArgumentDataMember = "Argument";
                series.ValueScaleType = ScaleType.Numerical;
            }
            series1.ValueDataMembers.AddRange(new string[] { "Actual" });
            series2.ValueDataMembers.AddRange(new string[] { "Target" });
            ((XYDiagram)chart.Diagram).AxisY.Label.TextPattern = "{V:$0}";

            form.ShowDialog();
            form.Dispose();
        }

        // Obtains a value of the axis point placed on the "default" axis
        // to display this value in the invoked form title.
        string GetFormTitle(MultiDimensionalData clickedItemData) {
            AxisPoint clickedPoint =
                clickedItemData.GetAxisPoints(DashboardDataAxisNames.DefaultAxis)[0];
            string clickedPointValue = clickedPoint.Value.ToString();
            return clickedPointValue;
        }
    }
}