DashboardItemSelectionChangedEventArgs Class
Provides data for the DashboardDesigner.DashboardItemSelectionChanged / DashboardViewer.DashboardItemSelectionChanged events.
Namespace: DevExpress.DashboardWin
Assembly: DevExpress.Dashboard.v26.1.Win.dll
Declaration
Remarks
The DashboardDesigner.DashboardItemSelectionChanged / DashboardViewer.DashboardItemSelectionChanged events are raised after the selection within the dashboard item is changed. The selection can be changed in the following ways.
- the state of master filter item is changed by an end-user or using the DashboardViewer‘s API (the DashboardViewer.SetMasterFilter or DashboardViewer.ClearMasterFilter methods);
- changing the selection within the dashboard item for which a custom visual interactivity is provided (using the DashboardViewer.DashboardItemVisualInteractivity event).
The DashboardItemVisualInteractivityBaseEventArgs.DashboardItemName property returns the name of the dashboard item for which the event was raised. Use the DashboardItemSelectionChangedEventArgs.CurrentSelection property to obtain the currently selected elements.
Example
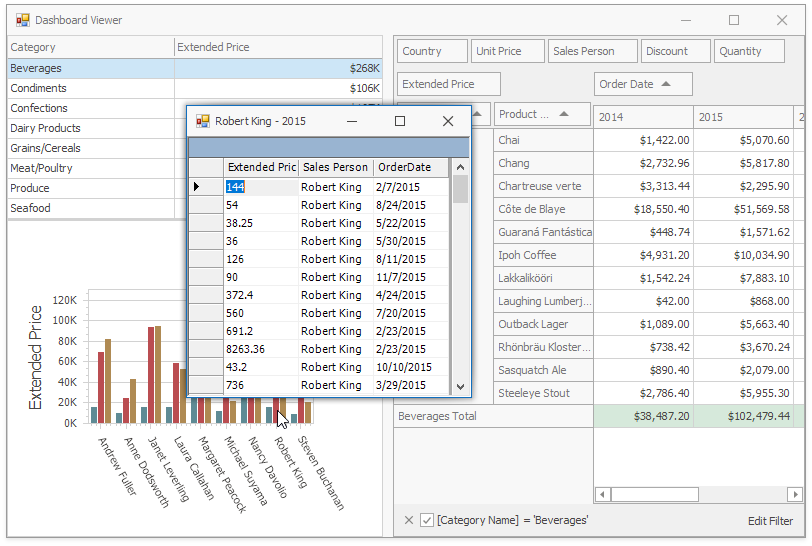
This example shows how to add a custom interactivity to a dashboard loaded in the WinForms Dashboard Viewer:
- A user can select records in the Grid dashboard item to filter data in the external Pivot Grid control.
- When a user clicks the chart series, the Data Grid control displays the corresponding underlying data.
To accomplish this, handle the following events:
DashboardViewer.DashboardItemVisualInteractivity event allows you to implement a custom Master Filtering.
DashboardViewer.DashboardItemSelectionChanged event allows you to filter data in the external PivotGridControl with the records selected in the Grid dashboard item.
The DashboardViewer.DashboardItemSelectionChanged event allows you to obtain underlying data when the user clicks the chart series.
This example operates with the MultiDimensionalData API. For more information on the MultiDimensionalData concept, refer to the Obtaining Underlying and Displayed Data document.
using DevExpress.DashboardCommon;
using DevExpress.DashboardCommon.ViewerData;
using DevExpress.DashboardWin;
using DevExpress.XtraEditors;
using DevExpress.XtraPivotGrid;
using System.Windows.Forms;

namespace Dashboard_CustomVisualInteractivity
{
    public partial class Form1 : XtraForm {
        public Form1() {
            InitializeComponent();
            dashboardViewer1.DataLoading += dashboardViewer1_DataLoading;
            dashboardViewer1.DashboardItemClick += dashboardViewer1_DashboardItemClick;
            dashboardViewer1.DashboardItemVisualInteractivity += dashboardViewer1_DashboardItemVisualInteractivity;
            dashboardViewer1.DashboardItemSelectionChanged += dashboardViewer1_DashboardItemSelectionChanged;

            salesPersonTableAdapter.Fill(nwindDataSet.SalesPerson);

            dashboardViewer1.LoadDashboard("Data\\Dashboard.xml");
        }

        private void dashboardViewer1_DashboardItemVisualInteractivity(object sender,
            DashboardItemVisualInteractivityEventArgs e) {
            if (e.DashboardItemName == "gridDashboardItem1") {
                e.SelectionMode = DashboardSelectionMode.Multiple;
                e.SetDefaultSelection(e.Data.GetAxisPoints(DashboardDataAxisNames.DefaultAxis)[0]);
            }
            if (e.DashboardItemName == "chartDashboardItem1") {
                e.TargetAxes.Add(DashboardDataAxisNames.ChartArgumentAxis);
                e.TargetAxes.Add(DashboardDataAxisNames.ChartSeriesAxis);
                e.EnableHighlighting = true;
            }
        }

        private void dashboardViewer1_DashboardItemSelectionChanged(object sender,
            DashboardItemSelectionChangedEventArgs e) {
            pivotGridControl1.BeginUpdate();
            fieldCategoryName1.FilterValues.FilterType = PivotFilterType.Included;
            fieldCategoryName1.FilterValues.Clear();
            foreach (AxisPointTuple selectedElement in e.CurrentSelection) {
                string category = selectedElement.GetAxisPoint().DimensionValue.Value.ToString();
                fieldCategoryName1.FilterValues.Add(category);
            }
            pivotGridControl1.EndUpdate();
        }

        private void dashboardViewer1_DashboardItemClick(object sender,
            DashboardItemMouseActionEventArgs e) {
            if (e.DashboardItemName == "chartDashboardItem1" && e.GetAxisPoint() != null) {
                XtraForm form = new XtraForm();
                form.Text = e.GetAxisPoint(DashboardDataAxisNames.ChartArgumentAxis).
                    DimensionValue.Value.ToString() + " - " +
                    e.GetAxisPoint(DashboardDataAxisNames.ChartSeriesAxis).
                    DimensionValue.Value.ToString();
                DataGrid grid = new DataGrid();
                grid.Parent = form; grid.Dock = DockStyle.Fill;
                grid.DataSource = e.GetUnderlyingData();
                form.ShowDialog();
                form.Dispose();
            }
        }

        private void dashboardViewer1_DataLoading(object sender, DataLoadingEventArgs e) {
            if (e.DataSourceComponentName == "dataSource1") {
                e.Data = nwindDataSet.SalesPerson;
            }
        }
    }
}