DashboardDesigner.CustomPalette Event
Provides the capability to substitute the default palette containing colors used to paint dashboard item elements.
Namespace: DevExpress.DashboardWin
Assembly: DevExpress.Dashboard.v25.2.Win.dll
NuGet Package: DevExpress.Win.Dashboard
Declaration
Event Data
The CustomPalette event's data class is CustomPaletteEventArgs. The following properties provide information specific to this event:
| Property | Description |
|---|---|
| Palette | Gets or sets a palette used to color dashboard item elements. |
Remarks
DevExpress Dashboard uses a set of 20 unique colors from the default palette to color dashboard item elements (for instance, Chart series points or Pie segments). You can use the static DashboardPalette.Default field to access the default palette.
Handle the CustomPalette event to create a your own palette providing custom colors. To do this, create and initialize the DashboardPalette class instance and assign the resulting object to the CustomPaletteEventArgs.Palette event parameter.
Example
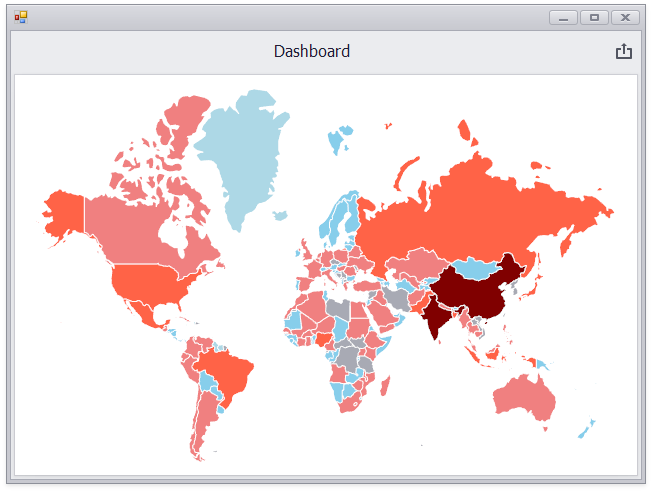
The following code snippets demonstrate how to customize a palette of the Choropleth map.
In this example, a set of custom colors is used to color map shapes depending on the provided values. Absolute values are used to specify endpoints for color ranges.

using System.Collections.Generic;
using System.Drawing;
using DevExpress.DashboardCommon;
using DevExpress.XtraEditors;

namespace Dashboard_ChoroplethMapCustomPalette {
    public partial class Form1 : XtraForm {
        public Form1() {
            InitializeComponent();
            // Loads a dashboard that contains a choropleth map with the default palette.
            Dashboard dashboard = new Dashboard();
            dashboard.LoadFromXml(@"..\..\Data\Dashboard.xml");

            // Gets the ValueMap object that provides data for coloring map shapes.
            ChoroplethMapDashboardItem map = (ChoroplethMapDashboardItem)dashboard.Items[0];
            ValueMap populationMap = (ValueMap)map.Maps[0];

            // Creates CustomPalette and CustomScale objects.
            CustomPalette customPalette = new CustomPalette();
            CustomScale customScale = new CustomScale();

            // Creates lists of custom colors and range stops.
            List<Color> customColors = new List<Color>();
            List<double> rangeStops = new List<double>();

            // Specifies that the absolute scale is used to define a set of colors.
            customScale.IsPercent = false;

            // Specifies custom colors and corresponding range stops.
            customColors.Add(Color.LightBlue);  rangeStops.Add(100000);
            customColors.Add(Color.SkyBlue);    rangeStops.Add(1000000);
            customColors.Add(Color.LightCoral); rangeStops.Add(10000000);
            customColors.Add(Color.Tomato);     rangeStops.Add(100000000);
            customColors.Add(Color.Maroon);     rangeStops.Add(1000000000);

            // Adds custom colors and range stops to a custom palette and corresponding custom scale.
            customPalette.Colors.AddRange(customColors);
            customScale.RangeStops.AddRange(rangeStops);

            // Specifies a custom palette and scale for the ValueMap object.
            populationMap.Palette = customPalette;
            populationMap.Scale = customScale;

            // Sets the customized dashboard as a currently opened dashboard.
            dashboardViewer1.Dashboard = dashboard;
        }
    }
}