GridDeltaColumn Class
A delta column in a GridDashboardItem.
Namespace: DevExpress.DashboardCommon
Assembly: DevExpress.Dashboard.v20.2.Core.dll
NuGet Packages: DevExpress.Dashboard.Core, DevExpress.WindowsDesktop.Dashboard.Core
Declaration
public class GridDeltaColumn :
    GridColumnBase,
    ISupportValueBarDisplayMode,
IDeltaNumericFormatHolderRemarks
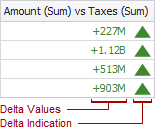
A delta column binds to two measures, calculates summaries for both and displays the difference between these summaries.
Measures to which a delta column is bound are called Actual and Target values. Use the GridDeltaColumn.ActualValue and GridDeltaColumn.TargetValue properties to specify these measures.
The dashboard calculates summaries against both measures using functions specified by their Measure.SummaryType properties and displays the difference between these summary values in the delta column.
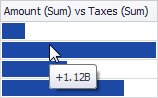
Values in the delta column can be displayed as text or represented by bars. To select between these modes, use the GridDeltaColumn.DisplayMode property.
Note
If bars are displayed, use the GridDeltaColumn.AlwaysShowZeroLevel property to specify whether the zero level is always shown.
Use the GridDeltaColumn.DeltaOptions property to access options that control the calculation of column values and define the delta indication.
The following code snippet creates the Delta column:
var grid = new GridDashboardItem();
grid.DataSource = dataSource;

var gridDelta = new GridDeltaColumn();
gridDelta.ActualValue = new Measure("Count");
gridDelta.TargetValue = new Measure("TargetCount");

grid.Columns.Add(gridDelta);