HighLowCloseSeries Class
A High-Low-Close series.
Namespace: DevExpress.DashboardCommon
Assembly: DevExpress.Dashboard.v20.2.Core.dll
NuGet Packages: DevExpress.Dashboard.Core, DevExpress.WindowsDesktop.Dashboard.Core
Declaration
Remarks
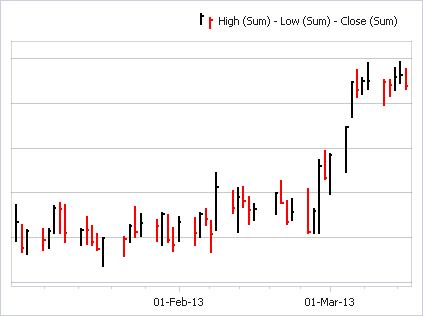
High-Low-Close series are used to show variation in stock prices over the course of a day. The Low and High prices are represented by the bottom and top values of the vertical line which is shown at each point, and the Close price is represented by the right tick mark. If the stock closes lower than the close price for the previous time period, the point is painted in red.
A High-Low-Close series requires three measures to be provided. These are measures containing the High, Low and Close prices.
Use the following properties to specify these measures.
Gets or sets a measure that contains High prices. | |
Gets or sets a measure that contains Low prices. | |
Gets or sets a measure that contains Close prices. |
To plot a series within the ChartDashboardItem, add the HighLowCloseSeries object to the ChartPane.Series collection of a pane where you need to display this series. To access a desired pane, use the ChartDashboardItem.Panes property.