Providing Data
- 4 minutes to read
The Dashboard Designer allows you to bind dashboard items to data in a uniform and similar manner. See the Bind Dashboard Items to Data topic for common information.
The difference is in the data sections that the specific dashboard item has. This topic describes how to bind filter elements to data in the Designer or in code.
Binding Overview
All filter elements provide the Dimensions data section, which accepts dimensions used to provide filter values. In code, you can provide the required dimensions using the FilterElementDashboardItem.FilterDimensions property.
To learn about the specifics of binding various filter elements to data, see the table below.
| Dashboard Item | Data Sections | Description |
|---|---|---|
| Combo Box | 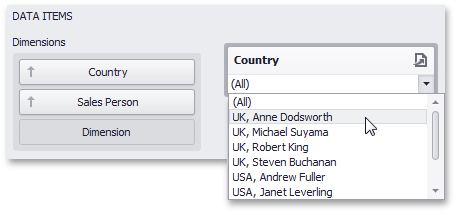 |
The Combo Box filter element can contain several dimensions at the Dimensions data section. In this case, the drop-down list will contain combinations of dimension values. |
| List Box | 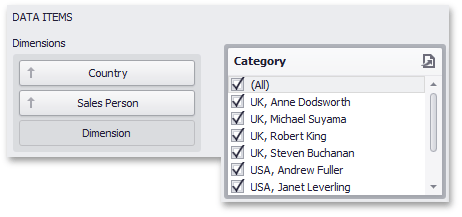 |
The List Box filter element can contain several dimensions at the Dimensions data section. In this case, the list will contain combinations of dimension values. |
| Tree View | 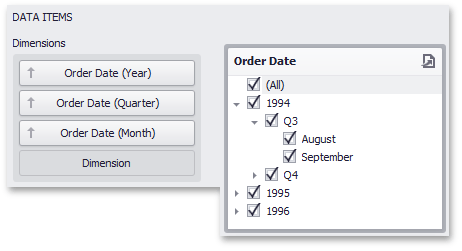 |
The Tree View filter element allows you to display dimension values hierarchically. This can be the set of dimensions with different group intervals (for instance, Year/Quarter/Month) or the set of related dimensions (for instance, geographical data such as continents/countries/cities). |
Example
This example demonstrates how to combine filter elements in a group and bind them to data in code.
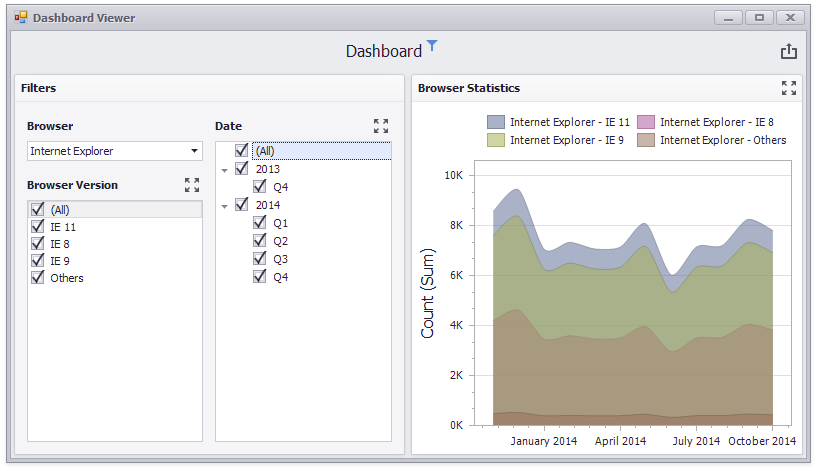
The dashboard contains the following filter items combined in a group:
The group serve as a master filter for the Chart dashboard item.
using DevExpress.DashboardCommon;
using DevExpress.DataAccess.ConnectionParameters;
using DevExpress.DataAccess.Sql;
using DevExpress.XtraEditors;
using System;

namespace Dashboard_FilterElements_and_Groups {
    public partial class Form1 : XtraForm {
        public Form1() {
            InitializeComponent();
        }

        private void Form1_Load(object sender, EventArgs e) {
            DashboardSqlDataSource dataSource = CreateDataSource();
            dashboardViewer1.Dashboard = CreateDashboard(dataSource);
            dashboardViewer1.SetMasterFilter("comboBoxDashboardItem1", "Internet Explorer");
        }

        private static DashboardSqlDataSource CreateDataSource() {
            DashboardSqlDataSource dataSource = new DashboardSqlDataSource();
            dataSource.ConnectionParameters =
                new XmlFileConnectionParameters(@"..\..\Data\WebsiteStatisticsData.xml");
            SelectQuery selectQuery = SelectQueryFluentBuilder
                .AddTable("Data")
                .SelectColumns("Browser", "BrowserDetails", "Date", "Count")
                .Build("Statistics");
            dataSource.Queries.Add(selectQuery);
            return dataSource;
        }

        private static Dashboard CreateDashboard(DashboardSqlDataSource dataSource) {
            Dashboard dashboard1 = new Dashboard();
            dashboard1.DataSources.Add(dataSource);

            ComboBoxDashboardItem comboBox1 = new ComboBoxDashboardItem() {
                Name = "Browser",
                DataSource = dataSource,
                DataMember = "Statistics",
                ComboBoxType = ComboBoxDashboardItemType.Checked
            };
            comboBox1.FilterDimensions.Add(new Dimension("Browser"));

            ListBoxDashboardItem listBox1 = new ListBoxDashboardItem() {
                Name = "Browser Version",
                DataSource = dataSource,
                DataMember = "Statistics"
            };
            listBox1.FilterDimensions.Add(new Dimension("BrowserDetails"));
            listBox1.InteractivityOptions.IgnoreMasterFilters = false;

            TreeViewDashboardItem treeView1 = new TreeViewDashboardItem() {
                Name = "Date",
                DataSource = dataSource,
                DataMember = "Statistics",
                AutoExpandNodes = true
            };
            treeView1.FilterDimensions.AddRange(new Dimension("Date", DateTimeGroupInterval.Year),
                new Dimension("Date", DateTimeGroupInterval.Quarter));

            DashboardItemGroup group1 = new DashboardItemGroup() {
                Name = "Filters"
            };
            group1.InteractivityOptions.IsMasterFilter = true;
            dashboard1.Groups.Add(group1);
            group1.AddRange(comboBox1, treeView1, listBox1);

            ChartDashboardItem chart1 = new ChartDashboardItem() {
                Name = "Browser Statistics",
                DataSource = dataSource,
                DataMember = "Statistics",
            };
            chart1.Arguments.Add(new Dimension("Date", DateTimeGroupInterval.MonthYear));
            chart1.SeriesDimensions.AddRange(new Dimension("Browser"), new Dimension("BrowserDetails"));
            chart1.Panes.Add(new ChartPane());
            SimpleSeries salesAmountSeries = new SimpleSeries(SimpleSeriesType.SplineArea);
            salesAmountSeries.Value = new Measure("Count");
            chart1.Panes[0].Series.Add(salesAmountSeries);
            dashboard1.Items.Add(chart1);

            return dashboard1;
        }
    }
}