Manage Interactivity Capabilities
- 4 minutes to read
Important
This documentation applies to v16.2. Starting with v17.1, the ASPxDashboardViewer control is in maintenance mode. In v19.1, the new Web Dashboard Control replaces the old Web Dashboard Viewer. This means that the Web Dashboard Viewer will not be included in our installation packages. See our blog post for more information.
Refer to the following KB articles to learn how to migrate to ASPxDashboard / ASP.NET MVC Dashboard:
ASPxDashboardViewer -> ASPxDashboard
How to migrate from ASPxDashboardViewer to ASPxDashboard working in the ViewerOnly mode
MVCxDashboardViewer -> MVCxDashboard
How to migrate from DashboardViewerExtension to DashboardExtension working in the ViewerOnly mode
To enable interaction between various dashboard items, use the Master Filtering and Drill-Down features.
The ASPxDashboardViewer allows you to apply master filtering and to perform drill-down on the client side. You can also provide custom visual interactivity for data-bound dashboard items that support element selection and highlighting using the ASPxClientDashboardViewer.ItemVisualInteractivity event.
Master Filtering
To learn how to apply filtering using a specific dashboard item, refer to End-User Documentation for Dashboard.
The ASPxClientDashboardViewer.CanSetMasterFilter method allows you to determine whether master filtering can be applied for the specified dashboard item. Use the ASPxClientDashboardViewer.GetAvailableFilterValues method to obtain the values of all elements that can be selected in the current state of the master filter item.
To apply filtering in code, use the ASPxClientDashboardViewer.SetMasterFilter method (or the ASPxClientDashboardViewer.SetRange method for the Range Filter dashboard item).
After filtering is applied or the state of the master filter item is changed, the ASPxClientDashboardViewer.MasterFilterSet event is raised. Its ASPxClientDashboardMasterFilterSetEventArgs.Values property allows you to obtain the currently selected values for the dashboard item that causes the event.
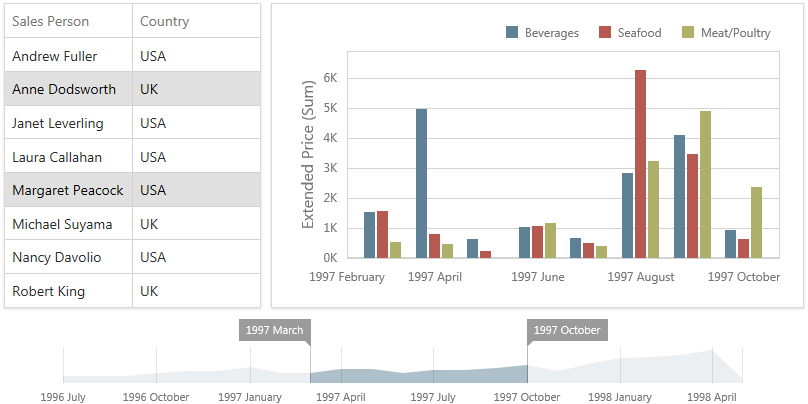
For instance, for the dashboard in the image above, the ASPxClientDashboardMasterFilterSetEventArgs.Values property returns “[Anne Dodsworth,UK]” and “[Margaret Peacock,USA]” for the Grid dashboard item. For the Range Filter dashboard item, the ASPxClientDashboardMasterFilterSetEventArgs.Values property returns minimum and maximum values in the selected range (these values are JavaScript date instances).
To clear the selection in the Master Filter item, use the ASPxClientDashboardViewer.ClearMasterFilter method.
After the selection is cleared, the ASPxClientDashboardViewer.MasterFilterCleared event is raised.
How to: Apply Default Filtering to Master Filters in ASPxDashboardViewer
How to: Apply Master Filtering in ASPxDashboardViewer
How to: Apply Master Filtering in ASPxDashboardViewer in OLAP Mode
How to: Apply Master Filtering in MVCxDashboardViewer
Drill-Down
To learn how end-users can drill down using a particular dashboard item, refer to End-User Documentation for Dashboard.
To perform drill-down/drill-up in code, use the ASPxClientDashboardViewer.PerformDrillDown/ASPxClientDashboardViewer.PerformDrillUp methods. The ASPxClientDashboardViewer.GetAvailableDrillDownValues method allows you to obtain values that can be used to perform drill-down.
After drill-down (or drill-up) is performed, the ASPxClientDashboardViewer.DrillDownPerformed (or ASPxClientDashboardViewer.DrillUpPerformed) event is raised.
The ASPxClientDashboardDrillDownPerformedEventArgs.Values property allows you to obtain values from the current drill-down hierarchy.
How to: Perform a Drill-Down in ASPxDashboardViewer
How to: Perform a Drill-Down in MVCxDashboardViewer
Custom Interactivity
The ASPxClientDashboardViewer allows you to provide custom visual interactivity for data-bound dashboard items that support element selection and highlighting using the ASPxClientDashboardViewer.ItemVisualInteractivity event. This event is raised for dashboard items with disabled master filtering. Visual interactivity is enabled for master filter items by default. The ASPxClientDashboardViewer also fires this event when master filtering is applied to the current dashboard item or drill-down is performed in this dashboard item.
Use the ASPxClientDashboardItemVisualInteractivityEventArgs.ItemName event parameter to obtain the name of the dashboard item for which the event was raised. The ASPxClientDashboardItemVisualInteractivityEventArgs.SetTargetAxes method allows you to specify data axes used to perform custom interactivity actions (selection of grid rows, selection and highlighting of chart series points, etc.).
To specify the selection mode and enable highlighting, use the ASPxClientDashboardItemVisualInteractivityEventArgs.SetSelectionMode and ASPxClientDashboardItemVisualInteractivityEventArgs.EnableHighlighting methods respectively. The ASPxClientDashboardItemVisualInteractivityEventArgs.SetDefaultSelection method provides the capability to specify the default selection for the current dashboard item.
After the selection is changed, the ASPxClientDashboardViewer.ItemSelectionChanged event is raised. Its ASPxClientDashboardItemSelectionChangedEventArgs.GetCurrentSelection method returns the selected elements.
The following table lists possible target axes for each dashboard item and supported interactivity capabilities.
Dashboard Item | Target Axes | Selection | Highlighting |
|---|---|---|---|
| |||
|
| ||
|
| ||
|
| ||
|
| ||
|
| ||
|
| ||
|
|

Note
Note that the Grid dashboard item does not support custom interactivity when Cell Merging is enabled.
How to: Add Custom Interactivity to a Dashboard Displayed in the Web Viewer