Axes
- 4 minutes to read
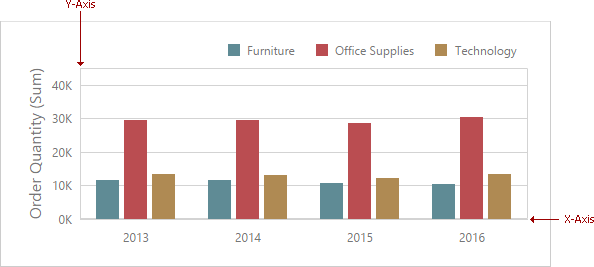
The Chart dashboard item displays two axes by default: the X-axis and the Y-axis. The X-axis is the axis of arguments and the Y-axis is the numerical axis of values.
Axis X
To access X-axis settings, go to the Chart’s Options menu and open the Axis X section.
You can configure the following settings:

| Option | API | Description |
|---|---|---|
| Reverse | ChartAxis.reverse | Specifies whether to reverse the X axis. If the X axis is reversed, its values are ordered from right to left. |
| Visible | ChartAxis.visible | Specifies whether the axis is visible. |
| Title | ChartAxis.title ChartAxis.titleVisible |
Specifies the X-axis title. Use the Title Text field to set the title. |
| Enable Zooming | ChartAxisX.enableZooming | Specifies whether to enable zooming for the X axis. |
| Limit Visible Points | ChartAxisX.limitVisiblePoints ChartAxisX.visiblePointsCount |
Specifies whether to limit the number of visible points. The Visible Points Count field allows you to specify the maximum number of visible points. |
Continuous and Discrete X-Axes
If the dimension in the Arguments section contains numeric data, the Chart can create either a continuous X-axis or a discrete X-axis.
If a continuous axis is used, the distance between argument values is proportional to their values. On a discrete axis, all argument values are an equal distance from each other.

To specify the X-axis type in the Web dashboard control, go to the data item Data Shaping menu for the argument dimension and select the axis type. The image below illustrates how to change this setting for the Product Base Margin data item.

Use the Dimension.isDiscreteNumericScale property to specify the X-axis type in code.
Axis Y
To access Y-axis settings, go to the Chart’s Options menu and open the Axis Y section for a corresponding pane.

| Option | API | Description |
|---|---|---|
| Always Show Zero Level | ChartAxisY.alwaysShowZeroLevel | Indicates whether an axis zero value is displayed. |
| Reverse | ChartAxis.reverse | Specifies whether to reverse the Y-axis. If the Y-axis is reversed, its values are ordered from top to bottom. |
| Grid Lines | ChartAxisY.showGridLines | Specifies whether to show the grid lines used to improve the readability of a chart’s visual data. |
| Visible | ChartAxis.visible | Specifies whether the axis is visible. |
| Title | ChartAxis.title ChartAxis.titleVisible |
Specifies the Y-axis title. Use the Title Text field to set the title. |
| Logarithmic Scale | ChartAxisY.logarithmic ChartAxisY.logarithmicBase |
Specifies whether to use a log scale to display Y-axis. Use the Logarithmic Scale Base field to set a log scale base. |
Secondary Axis
The secondary Y-axis is useful when it is necessary to visually combine several charts into one. Secondary axes provide the ability to plot series with different ranges on the same chart.
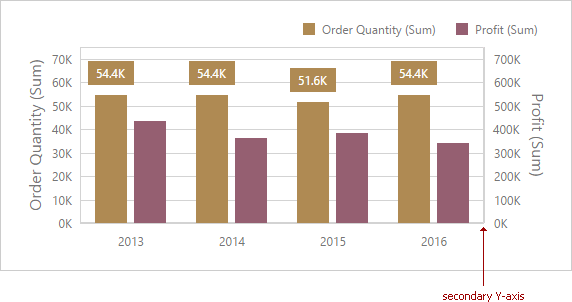
To plot the required series using the secondary axis, go to the data item Options menu for the value measure and turn the Plot on Secondary Axis option on.
The secondary axis is the DevExpress.Dashboard.Model.ChartSecondaryAxisY class implementation.
Numeric Format Settings
The Numeric Format section allows you to specify the numeric display formats for Y-Axis/X-Axis data, as described in the Formatting Data document.

The section contains the following settings.
| Option | API | Description |
|---|---|---|
| Format type | DataItemNumericFormat.formatType | Specifies the format type for numeric values. |
| Unit | DataItemNumericFormat.unit | Specifies the unit to convert the numeric values. |
| Precision | DataItemNumericFormat.precision | Specifies the number of fractional digits to display. |
| Include group separator | DataItemNumericFormat.includeGroupSeparator | Specifies whether separators should be inserted between digit groups. |
| Currency | DataItemNumericFormat.currencyCultureName | Specifies the currency symbol and format provided by the RegionInfo class. |
DateTime Format Settings
For date and time arguments, the X-Axis/Y-Axis Settings section displays the additional Numeric Format section. Here you can specify the date and time display formats for X-Axis/Y-Axis data. To set date and time format in code, use the ChartAxisX.dateTimeFormat property.
Specify group interval in the data item’s Group Interval option:

Refer to the following article to see available values that specify the group interval for date-time values: TimeGroupInterval Type.
To specify a custom format for the date, set the data item’s Group Interval option to Exact Date. This provides additional settings in the data item menu’s Format Type section.

The section contains settings described in detail in the Formatting Data document.