What is BI Dashboard
- 5 minutes to read
The DevExpress BI Dashboard is a set of tools that allows you to create an application with a graphical user interface — a dashboard. The function of the dashboard is to display results by aggregating and extracting values from the connected data source. This data can be used to explore statistics, metrics, and KPI of your business, department, or organization in the form of different data visualization widgets (grids, charts, gauges, and others).
The key to creating a dashboard is the Dashboard Control. Dashboard Controls allow you to select and visualize what is important from the loaded data.
The image below shows row data that is aggregated and formatted in a dashboard. The dashboard displays information about bike sales in 2019: the grid on the right displays all sale records grouped by state, and charts on the left break down total sale and revenue figures into categories.

Benefits of DevExpress BI Dashboard Controls:
- Runtime data source Wizard
- Runtime Dashboard Designer
- Data aggregation support
- Cross-Platform Viewers
- Broad set of data visualization widgets (grids, charts, gauges, and others)
- Uniform themes, styles, and coloring
- Layout management and customization
- Runtime end-user customization
- Built-in interactivity
- Export
BI Dashboard Architecture
The DevExpress BI Dashboard is part of the Universal Subscription. The BI Dashboard includes the following controls: Dashboard Designer and Dashboard Viewer controls for WinForms, Dashboard Viewer for WPF, and Web Dashboard Controls that can switch between Viewer and Designer modes.
Dashboard Lifecycle
The following schema illustrates the complete dashboard lifecycle:

Data Source
Dashboard Controls support different types of data sources — SQL, OLAP, Microsoft Excel workbooks, JSON, and more. Create a data extract to reduce the time for processing a query from a large database, or unite several data sources and transform them into a federated data source.
Dashboard Designer
Use the Dashboard Designer to create a dashboard in a few clicks: connect to a database, add UI elements, and configure data aggregation and visualization settings.
You can incorporate DevExpress Dashboard Designers into your applications. If you do so, users can create their own dashboards or modify existing dashboards without writing a single line of code.
Dashboard
The resulting dashboard is an XML file or a Dashboard class descendant that stores the created visualization and all settings such as applied filters, layout settings, data connections, and more. You can create a dashboard file at runtime in the Dashboard Designer. The dashboard component (a dashboard descendant) can be created at design time in the Visual Studio Designer. The Dashboard Viewer displays both variants.
Dashboard Viewer
The Dashboard Viewer displays dashboards and allows users to interact with data.
Supported Platforms
The Dashboard Controls are available on the following Platforms:
- Web
- WinForms
- WPF
The BI Dashboard supports both .NET and .NET Framework.
Cross-Platform Implementation
The Web and Desktop Dashboard Controls can both open the same dashboard, which makes the dashboard cross-platform.
    <?xml version="1.0" encoding="utf-8"?>
    <Dashboard>
    <Title Text="Sample Dashboard" />
    <DataSources>
        <SqlDataSource Name="SalesPerson" ComponentName="DataSource1">
        <Connection Name="NWindConnectionString" FromAppConfig="true" />
        <Query Type="SelectQuery" Name="SalesPerson">
            <Tables>
            <Table Name="SalesPerson" />
            </Tables>
            <Columns>
            <AllColumns Table="SalesPerson" />
            </Columns>
        </Query>
        <ConnectionOptions CloseConnection="true" />
        </SqlDataSource>
    </DataSources>
    <Items>
        <Chart ComponentName="chartDashboardItem1" Name="Chart 1" DataSource="DataSource1" DataMember="SalesPerson">
        <DataItems>
            <Measure DataMember="Extended Price" DefaultId="DataItem0" />
            <Dimension DataMember="CategoryName" DefaultId="DataItem1" />
            <Dimension DataMember="Country" DefaultId="DataItem2" />
        </DataItems>
        <SeriesDimensions>
            <SeriesDimension DefaultId="DataItem2" />
        </SeriesDimensions>
        <Arguments>
            <Argument DefaultId="DataItem1" />
        </Arguments>
        <Panes>
            <Pane Name="Pane 1">
            <Series>
                <Simple>
                <Value DefaultId="DataItem0" />
                </Simple>
            </Series>
            </Pane>
        </Panes>
        </Chart>
        <ListBox ComponentName="listBoxDashboardItem1" Name="List Box 1" DataSource="DataSource1" DataMember="SalesPerson">
        <DataItems>
            <Dimension DataMember="CategoryName" DefaultId="DataItem0" />
        </DataItems>
        <FilterDimensions>
            <Dimension DefaultId="DataItem0" />
        </FilterDimensions>
        </ListBox>
    </Items>
    <LayoutTree>
        <LayoutGroup Weight="100">
        <LayoutItem DashboardItem="listBoxDashboardItem1" Weight="34.589299171062549" />
        <LayoutItem DashboardItem="chartDashboardItem1" Weight="165.41070082893745" />
        </LayoutGroup>
    </LayoutTree>
    </Dashboard>
For example, you can create and configure a dashboard in the WinForms Designer and open the dashboard in the Web Dashboard Control:

WinForms Designer

Web Dashboard Control
Role and Access Permission Control
Dashboard Controls ship a set of API that allows you to create user groups with different access permissions (for example, a designer for admins, and a viewer for users). As a result, you can set up access permissions for the displayed data and dashboards independently.
Included Widgets and Custom Item Support
Dashboard Controls include three types of widgets:
- Data Visualization Items
- Display data in a dashboard.
- Filter Elements
- Apply filters to visualization items.
- Dashboard Item Containers
- Arrange items and manage dashboard item interaction inside and outside the container.
If you want to include a widget that is not supported, you can create a Custom Dashboard Item.
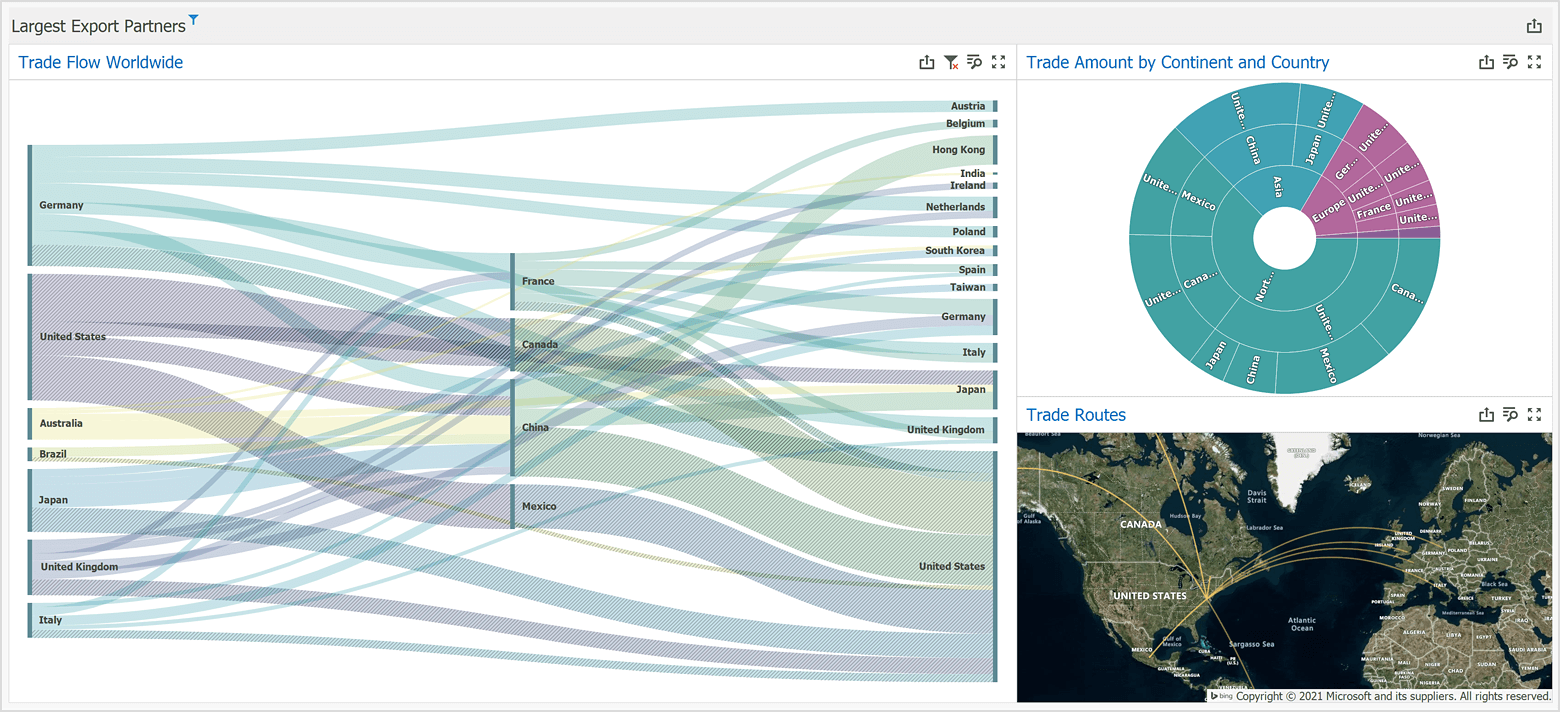
The following image illustrates Custom Sankey, Sunburst, and Custom Map items:
Data Shaping
Group, sort, filter, and conditionally format dashboard data as your data analysis tasks dictate.
Dashboard-Level Interactivity
Master Filter and Drill-Down features enable interaction between dashboard items and allow users to filter and view data at different detail levels. You can also implement custom interactivity such as item element selection and highlighting in code.
Customization
If the built-in capabilities do not completely suit your goals, use the control’s extensibility API to extend/modify Dashboard functionality.
Export
Dashboard controls allow users to print/export an entire dashboard or individual dashboard items to the following formats:
- Image
- Excel/CSV
You can also use non-visual export components to implement export of a dashboard or dashboard items at runtime.