XYDiagram2D.PaneDistance Property
Specifies the distance between a diagram’s panes.
Namespace: DevExpress.XtraCharts
Assembly: DevExpress.XtraCharts.v18.2.dll
Declaration
[XtraChartsLocalizableCategory(XtraChartsCategory.Behavior)]
[XtraSerializableProperty]
public int PaneDistance { get; set; }Property Value
| Type | Description |
|---|---|
| Int32 | An integer value which specifies the distance between panes, in pixels. |
Remarks
Use the PaneDistance property, to specify the distance between a diagram’s panes.
To specify the layout direction of panes, use the XYDiagram2D.PaneLayoutDirection property.
For more information, refer to Panes.
Example
This example demonstrates how panes can be accessed and customized at runtime.
Assuming that there are two series of the line view type in the chart, in the following code, we create an additional pane, and assign the second series to it. In addition, a secondary axis is created and assigned to that series, and it is also visible in the additional pane.
using System;
using System.Drawing;
using System.Windows.Forms;
using DevExpress.XtraCharts;
// ...
private void Form1_Load(object sender, EventArgs e) {
// Create a new chart.
ChartControl chartControl1 = new ChartControl();
// Create two series.
Series series1 = new Series("Series 1", ViewType.Bar);
Series series2 = new Series("Series 2", ViewType.Line);
// Add points to them, with their arguments different.
series1.Points.Add(new SeriesPoint("A", 10));
series1.Points.Add(new SeriesPoint("B", 12));
series1.Points.Add(new SeriesPoint("C", 17));
series1.Points.Add(new SeriesPoint("D", 14));
series2.Points.Add(new SeriesPoint("I", 2500));
series2.Points.Add(new SeriesPoint("II", 3800));
series2.Points.Add(new SeriesPoint("III", 1500));
series2.Points.Add(new SeriesPoint("IV", 1300));
// Add both series to the chart.
chartControl1.Series.AddRange(new Series[] { series1, series2 });
// Hide the legend (optional).
chartControl1.Legend.Visible = false;
// Cast the chart's diagram to the XYDiagram type,
// to access its axes and panes.
XYDiagram diagram = (XYDiagram)chartControl1.Diagram;
// Add secondary axes to the diagram, and adjust their options.
diagram.SecondaryAxesX.Add(new SecondaryAxisX("My Axis X"));
diagram.SecondaryAxesY.Add(new SecondaryAxisY("My Axis Y"));
diagram.SecondaryAxesX[0].Alignment = AxisAlignment.Near;
diagram.SecondaryAxesY[0].Alignment = AxisAlignment.Near;
// Add a new additional pane to the diagram.
diagram.Panes.Add(new XYDiagramPane("My Pane"));
// Assign both the additional pane and, if required,
// the secondary axes to the second series.
LineSeriesView myView = (LineSeriesView)series2.View;
myView.AxisX = diagram.SecondaryAxesX[0];
myView.AxisY = diagram.SecondaryAxesY[0];
// Note that the created pane has the zero index in the collection,
// because the existing Default pane is a separate entity.
myView.Pane = diagram.Panes[0];
// Customize the layout of the diagram's panes.
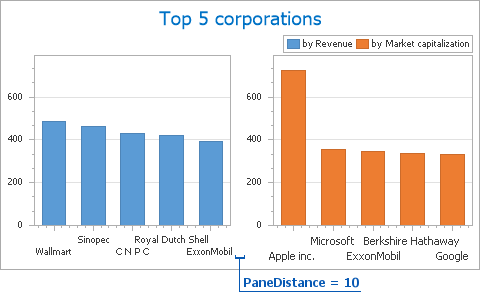
diagram.PaneDistance = 10;
diagram.PaneLayoutDirection = PaneLayoutDirection.Horizontal;
diagram.DefaultPane.SizeMode = PaneSizeMode.UseWeight;
diagram.DefaultPane.Weight = 1.2;
// Add the chart to the form.
chartControl1.Dock = DockStyle.Fill;
this.Controls.Add(chartControl1);
}