GanttSeriesView.LinkOptions Property
Gets the task link options which specify the appearance of task links within a Gantt series view.
Namespace: DevExpress.XtraCharts
Assembly: DevExpress.XtraCharts.v21.2.dll
NuGet Package: DevExpress.Charts
Declaration
[PersistenceMode(PersistenceMode.InnerProperty)]
[XtraChartsLocalizableCategory(XtraChartsCategory.Layout)]
public TaskLinkOptions LinkOptions { get; }Property Value
| Type | Description |
|---|---|
| TaskLinkOptions | A TaskLinkOptions object which contains appearance settings for task links. |
Remarks
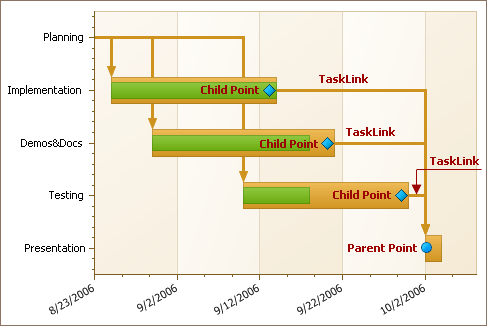
A TaskLink object is specific for a GanttDiagram only. It represents the relation between series points. It is displayed as an arrowed line connecting child and parent points, oriented towards the parent point. The image below illustrates the common look of a Gantt chart with task links between its bars.
The TaskLinkOptions class provides the TaskLinkOptions.ArrowHeight and TaskLinkOptions.ArrowWidth properties to customize the way an arrow head is displayed. Use the TaskLinkOptions.Color and TaskLinkOptions.ColorSource properties to specify the color of the task link line and arrow head, and other properties to customize other appearance elements of a task link. Note also that you can set the TaskLinkOptions.Visible property to false to hide all the task links shown within a Gantt diagram.
Example
The following example demonstrates how to create a ChartControl with two series of the OverlappedGanttSeriesView type, and add this chart to a form at runtime. Before proceeding with this example, first create a Windows Forms Application in Visual Studio, and include all necessary assemblies to the References list of your project.
Then, add the following code to the Form.Load event handler.
using System;
using System.Windows.Forms;
using DevExpress.XtraCharts;
// ...
private void Form1_Load(object sender, EventArgs e) {
// Create a new chart.
ChartControl overlappedGanttChart = new ChartControl();
// Create two Gantt series.
Series series1 = new Series("Planned", ViewType.Gantt);
Series series2 = new Series("Completed", ViewType.Gantt);
// Set the date-time values scale type for both series,
// as it is qualitative, by default.
series1.ValueScaleType = ScaleType.DateTime;
series2.ValueScaleType = ScaleType.DateTime;
// Add points to them.
series1.Points.Add(new SeriesPoint("Market analysis", new DateTime[] {
new DateTime(2006, 8, 16), new DateTime(2006, 8, 23) }));
series1.Points.Add(new SeriesPoint("Feature planning", new DateTime[] {
new DateTime(2006, 8, 23), new DateTime(2006, 8, 26) }));
series1.Points.Add(new SeriesPoint("Implementation", new DateTime[] {
new DateTime(2006, 8, 26), new DateTime(2006, 9, 26) }));
series1.Points.Add(new SeriesPoint("Testing & bug fixing", new DateTime[] {
new DateTime(2006, 9, 26), new DateTime(2006, 10, 10) }));
series2.Points.Add(new SeriesPoint("Market analysis", new DateTime[] {
new DateTime(2006, 8, 16), new DateTime(2006, 8, 23) }));
series2.Points.Add(new SeriesPoint("Feature planning", new DateTime[] {
new DateTime(2006, 8, 23), new DateTime(2006, 8, 26) }));
series2.Points.Add(new SeriesPoint("Implementation", new DateTime[] {
new DateTime(2006, 8, 26), new DateTime(2006, 9, 10) }));
// Add both series to the chart.
overlappedGanttChart.Series.AddRange(new Series[] { series1, series2 });
// Access the view-type-specific options of the series.
((GanttSeriesView)series1.View).BarWidth = 0.6;
((GanttSeriesView)series2.View).BarWidth = 0.3;
// Access the type-specific options of the diagram.
GanttDiagram myDiagram = (GanttDiagram)overlappedGanttChart.Diagram;
myDiagram.AxisY.Interlaced = true;
myDiagram.AxisY.GridSpacing = 10;
myDiagram.AxisY.Label.Angle = -30;
myDiagram.AxisY.DateTimeOptions.Format = DateTimeFormat.MonthAndDay;
// Add task links for the first Gantt series.
((GanttSeriesView)series1.View).LinkOptions.ArrowHeight = 7;
((GanttSeriesView)series1.View).LinkOptions.ArrowWidth = 11;
for (int i = 1; i < series1.Points.Count; i++) {
series1.Points[i].Relations.Add(series1.Points[i - 1]);
}
// Add a progress line.
ConstantLine progress =
new ConstantLine("Current progress", new DateTime(2006, 9, 10));
progress.ShowInLegend = false;
progress.Title.Alignment = ConstantLineTitleAlignment.Far;
myDiagram.AxisY.ConstantLines.Add(progress);
// Adjust the legend.
overlappedGanttChart.Legend.AlignmentHorizontal =
LegendAlignmentHorizontal.Right;
// Add a title to the chart (if necessary).
overlappedGanttChart.Titles.Add(new ChartTitle());
overlappedGanttChart.Titles[0].Text = "R&D Schedule";
// Add the chart to the form.
overlappedGanttChart.Dock = DockStyle.Fill;
this.Controls.Add(overlappedGanttChart);
}