PointView Enum
Lists the values used to specify how data point information is represented within series labels.
Namespace: DevExpress.XtraCharts
Assembly: DevExpress.XtraCharts.v21.2.dll
NuGet Package: DevExpress.Charts
Declaration
Members
| Name | Description |
|---|---|
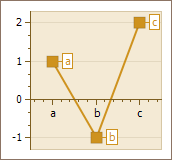
Argument
|
Specifies that series labels identify series points by their argument values (which can be taken from the SeriesPoint.Argument property).
|
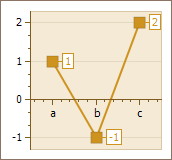
Values
|
Specifies that series labels identify data points by their values (which can be taken from the SeriesPoint.Values property).
|
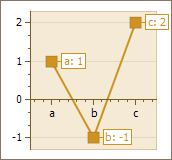
ArgumentAndValues
|
Specifies that series labels reflect both arguments and values for the corresponding series points. In this case, the resulting label content is composed of the SeriesPoint.Argument and SeriesPoint.Values property values, based on the specified PointOptions.Pattern.
|
SeriesName
|
Specifies that series labels identify series points by the name of their series (which can be taken from the Series.Name property). |
Undefined
|
This means the PointOptions.PointView property value is ignored, and the text of series labels is determined by the PointOptions.Pattern property value. |
Related API Members
The following properties accept/return PointView values:
Remarks
The values listed by the PointView enumeration are used to set the PointOptions.PointView property.
Example
The following example demonstrates how to create a ChartControl with a series of the PieSeriesView type, and add this chart to a form at runtime.
Note that this series view type is associated with the SimpleDiagram type, and you should cast your diagram object to this type, in order to access its specific options.
Note
A complete sample project is available at https://github.com/DevExpress-Examples/winforms-charts-create-a-pie-chart
using System;
using System.Windows.Forms;
using DevExpress.XtraCharts;
// ...

namespace Series_PieChart {
    public partial class Form1 : Form {
        public Form1() {
            InitializeComponent();
        }

        private void Form1_Load(object sender, EventArgs e) {
            // Create an empty chart.
            ChartControl pieChart = new ChartControl();

            // Create a pie series.
            Series series1 = new Series("A Pie Series", ViewType.Pie);

            // Populate the series with points.
            series1.Points.Add(new SeriesPoint("Russia", 17.0752));
            series1.Points.Add(new SeriesPoint("Canada", 9.98467));
            series1.Points.Add(new SeriesPoint("USA", 9.63142));
            series1.Points.Add(new SeriesPoint("China", 9.59696));
            series1.Points.Add(new SeriesPoint("Brazil", 8.511965));
            series1.Points.Add(new SeriesPoint("Australia", 7.68685));
            series1.Points.Add(new SeriesPoint("India", 3.28759));
            series1.Points.Add(new SeriesPoint("Others", 81.2));

            // Add the series to the chart.
            pieChart.Series.Add(series1);

            // Format the the series labels.
            series1.Label.TextPattern = "{A}: {VP:p0}";

            // Adjust the position of series labels.
            ((PieSeriesLabel)series1.Label).Position = PieSeriesLabelPosition.TwoColumns;

            // Detect overlapping of series labels.
            ((PieSeriesLabel)series1.Label).ResolveOverlappingMode = ResolveOverlappingMode.Default;

            // Access the view-type-specific options of the series.
            PieSeriesView myView = (PieSeriesView)series1.View;

            // Show a title for the series.
            myView.Titles.Add(new SeriesTitle());
            myView.Titles[0].Text = series1.Name;

            // Specify a data filter to explode points.
            myView.ExplodedPointsFilters.Add(new SeriesPointFilter(SeriesPointKey.Value_1,
                DataFilterCondition.GreaterThanOrEqual, 9));
            myView.ExplodedPointsFilters.Add(new SeriesPointFilter(SeriesPointKey.Argument,
                DataFilterCondition.NotEqual, "Others"));
            myView.ExplodeMode = PieExplodeMode.UseFilters;
            myView.ExplodedDistancePercentage = 30;
            myView.RuntimeExploding = true;
            myView.HeightToWidthRatio = 0.75;

            // Hide the legend (if necessary).
            pieChart.Legend.Visibility = DevExpress.Utils.DefaultBoolean.False;

            // Add the chart to the form.
            pieChart.Dock = DockStyle.Fill;
            this.Controls.Add(pieChart);
        }
    }
}