SummaryDataAdapter Class
An adapter that creates series points based on data source item summaries.
Namespace: DevExpress.XtraCharts
Assembly: DevExpress.XtraCharts.v21.2.dll
NuGet Package: DevExpress.Charts
Declaration
public class SummaryDataAdapter :
    CachedPointDataAdapter,
    ISummaryAdapter,
ISummaryOptionsOwnerRemarks
The SummaryDataAdapter allows you to summarize values of points with the same arguments.
Depending on the argument axis scale type, you should use one of the following properties to define scale-specific options:
The SummaryOptionsBase.SummaryFunction property allows you to specify the function used to summarize points. The following functions are available:
- MIN([Data_Member_Name])
- MAX([Data_Member_Name])
- AVERAGE([Data_Member_Name])
- SUM([Data_Member_Name])
- COUNT()
Some functions require you to specify the data member name (the Data_Member_Name parameter) that supplies values to summarize.
Use the ChartControl.RegisterSummaryFunction method to create a new function.
Example
The following example shows how to create a series and aggregate points with equal arguments.
| A summary function is not applied. | A summary function (SUM) is applied. |
|---|---|
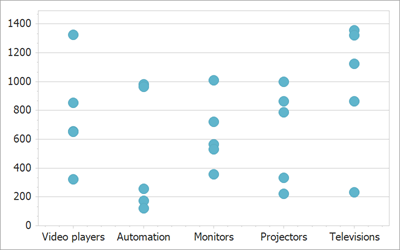 |
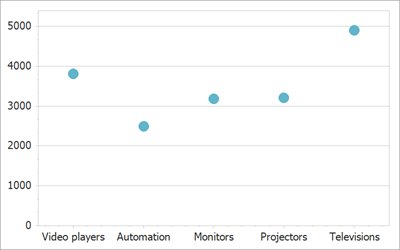 |
- Create a
SummaryDataAdapterobject. - Define the adapter’s DataSource property.
- Populate the adapter DataMembers collection. You should specify data members that contain arguments and values.
- Specify the SummaryOptionsBase.SummaryFunction property to select a function used to summarize values.
- Use the Series.DataAdapter property to assign the adapter to the series.
using System;
using System.Windows.Forms;
using DevExpress.XtraCharts;

namespace SummaryChart {
        private void OnLoad(object sender, EventArgs e) {
            // Create a series.
            Series series = new Series("Series", ViewType.Point);

            // Create a summary data adapter.
            SummaryDataAdapter dataAdapter = new SummaryDataAdapter();

            // Specify the data source.
            dataAdapter.DataSource = SaleInfo.GetSaleInfos();

            // Create a data member that defines arguments.
            dataAdapter.DataMembers.Add(new DataMember {
                DataMemberType = ChartDataMemberType.Argument,
                ColumnName = "Category",
                ScaleType = ScaleType.Qualitative
            });
            // Create a data member that defines values.
            dataAdapter.DataMembers.Add(new DataMember {
                DataMemberType = ChartDataMemberType.Value,
                ColumnName = "Value",
                ScaleType = ScaleType.Numerical
            });

            // Specify a summary function.
            dataAdapter.QualitativeSummaryOptions.SummaryFunction = "SUM([Value])";

            // Assign the data adapter to the series.
            series.DataAdapter = dataAdapter;

            // Add the series to the chart.
            chart.Series.Add(series);

        }

        public class SaleInfo {
            public string Category { get; set; }
            public string Region { get; set; }
            public double Value { get; set; }

            public static List<SaleInfo> GetSaleInfos() {
                return new List<SaleInfo> {
                    new SaleInfo { Category= "Video players", Region = "Asia",          Value = 853D},
                    new SaleInfo { Category= "Video players", Region = "Australia",     Value = 321D},
                    new SaleInfo { Category= "Video players", Region = "Europe",        Value = 655D},
                    new SaleInfo { Category= "Video players", Region = "North America", Value = 1325D},
                    new SaleInfo { Category= "Video players", Region = "South America", Value = 653D},
                    new SaleInfo { Category= "Automation",    Region = "Asia",          Value = 172D},
                    new SaleInfo { Category= "Automation",    Region = "Australia",     Value = 255D},
                    new SaleInfo { Category= "Automation",    Region = "Europe",        Value = 981D},
                    new SaleInfo { Category= "Automation",    Region = "North America", Value = 963D},
                    new SaleInfo { Category= "Automation",    Region = "South America", Value = 123D},
                    new SaleInfo { Category= "Monitors",      Region = "Asia",          Value = 1011D},
                    new SaleInfo { Category= "Monitors",      Region = "Australia",     Value = 359D},
                    new SaleInfo { Category= "Monitors",      Region = "Europe",        Value = 721D},
                    new SaleInfo { Category= "Monitors",      Region = "North America", Value = 565D},
                    new SaleInfo { Category= "Monitors",      Region = "South America", Value = 532D},
                    new SaleInfo { Category= "Projectors",    Region = "Asia",          Value = 998D},
                    new SaleInfo { Category= "Projectors",    Region = "Australia",     Value = 222D},
                    new SaleInfo { Category= "Projectors",    Region = "Europe",        Value = 865D},
                    new SaleInfo { Category= "Projectors",    Region = "North America", Value = 787D},
                    new SaleInfo { Category= "Projectors",    Region = "South America", Value = 332D},
                    new SaleInfo { Category= "Televisions",   Region = "Asia",          Value = 1356D},
                    new SaleInfo { Category= "Televisions",   Region = "Australia",     Value = 232D},
                    new SaleInfo { Category= "Televisions",   Region = "Europe",        Value = 1323D},
                    new SaleInfo { Category= "Televisions",   Region = "North America", Value = 1125D},
                    new SaleInfo { Category= "Televisions",   Region = "South America", Value = 865D}
                };
            }
        }
    }
}