BoxPlotSeriesView.CapWidthPercentage Property
Gets or sets the cap width of a Box Plot series point as percentage.
Namespace: DevExpress.XtraCharts
Assembly: DevExpress.XtraCharts.v21.2.dll
NuGet Package: DevExpress.Charts
Declaration
[XtraChartsLocalizableCategory(XtraChartsCategory.Layout)]
public double CapWidthPercentage { get; set; }Property Value
| Type | Description |
|---|---|
| Double | A number that specifies the cap width as the percentage of box width. |
Remarks
Set the CapWidthPercentage property value to 100 to make the cap width equal to the box plot point width.
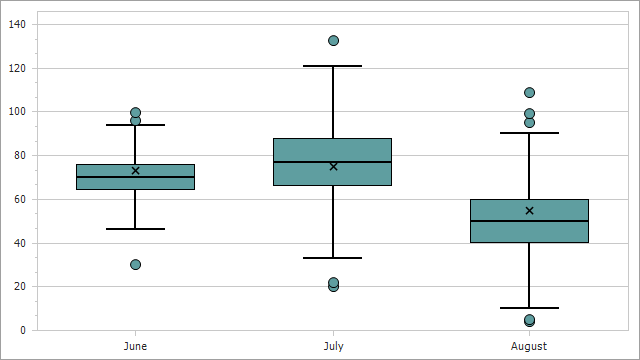
Example
This example shows how to create a Box Plot chart.
- Add a Chart Control to a WinForms project.
- Add a series to a chart.
- Specify the series data members.
- Use the BoxPlotSeriesView object to configure the series view options.
using DevExpress.XtraCharts;
using System;
using System.Collections.Generic;
using System.Drawing;
using System.Windows.Forms;

namespace BoxPlotChart {
    public partial class Form1 : Form {
        public Form1() {
            InitializeComponent();
        }
        private void Form1_Load(object sender, EventArgs e) {
            Series series = new Series("Box Plot", ViewType.BoxPlot);
            series.DataSource = DataPoint.GetDataPoints();
            series.SetBoxPlotDataMembersWithOutliers("Argument", "Min", "Quartile1", "Median", "Quartile3", "Max", "Mean", "Outliers");
            chartControl1.Series.Add(series);

            BoxPlotSeriesView view = series.View as BoxPlotSeriesView;
            view.EqualBoxWidth = true;
            view.Color = Color.CadetBlue;
            view.CapWidthPercentage = 50;
            view.MeanAndMedianColor = Color.Black;
            view.MeanMarkerKind = MarkerKind.ThinCross;
            view.MeanMarkerSize = 10;
            view.Border.Color = Color.Black;
            view.Border.Thickness = 1;
            view.Border.Visibility = DevExpress.Utils.DefaultBoolean.True;

            XYDiagram diagram = chartControl1.Diagram as XYDiagram;
            diagram.AxisX.Tickmarks.MinorVisible = false;
        }
    }
    public class DataPoint {
        public string Argument { get; set; }
        public double Min { get; set; }
        public double Max { get; set; }
        public double Quartile1 { get; set; }
        public double Quartile3 { get; set; }
        public double Median { get; set; }
        public double Mean { get; set; }
        public double[] Outliers { get; set; }
        public DataPoint(string argument, double min, double max, double q1, double q3, double median, double mean, double[] outliers) {
            this.Argument = argument;
            this.Min = min;
            this.Max = max;
            this.Quartile1 = q1;
            this.Quartile3 = q3;
            this.Median = median;
            this.Mean = mean;
            this.Outliers = outliers;
        }
        public static List<DataPoint> GetDataPoints() {
            List<DataPoint> data = new List<DataPoint> {
                new DataPoint("June", 46, 94, 64, 76, 70, 73, new double[]{ 30, 96.3, 99.56 }),
                new DataPoint("July", 33, 121, 66, 88, 77, 75, new double[]{ 20, 22, 132.7 }),
                new DataPoint("August", 10, 90, 40, 60, 50, 55, new double[]{ 4, 5, 95.4, 99.3, 109 })
            };
            return data;
        }
    }
}
See Also