Get Started with Charts
- 6 minutes to read
This tutorial describes how to build a simple Blazor application with a DevExpress Chart component. Follow the steps below to display a 10-day weather forecast.
Create an Application
Refer to the Create an application section for instructions.
If you use Microsoft project templates, do the following:
- Configure the application as described in this topic: Microsoft Templates (NuGet Packages).
- Apply the DevExpress Blazing Berry theme as described in this topic: Apply a DevExpress Theme.
Add a Chart and Bind It to Data
Add the
<DxChart>and</DxChart>tags to the Pages/Index.razor page.<DxChart> </DxChart>In the Razor
@codeblock, create a WeatherForecast class and add Date, TemperatureC, and Precipitation fields.@code { public class WeatherForecast { public DateTime Date { get; set; } public int TemperatureC { get; set; } public double Precipitation { get; set; } } }Declare the forecasts property (an array of WeatherForecast objects). Fill this array, for instance, in the OnInitialized lifecycle method.
@code {
    // ...

    private WeatherForecast[] forecasts;

    protected override void OnInitialized() {
        forecasts = GetForecast();
    }

    public WeatherForecast[] GetForecast() {
        WeatherForecast[] forecasts = new WeatherForecast[] {
                new WeatherForecast() { Date = new DateTime(2020, 05, 11), TemperatureC = 20,
                                        Precipitation = 5},
                new WeatherForecast() { Date = new DateTime(2020, 05, 12), TemperatureC = 22,
                                        Precipitation = 1.2},
                new WeatherForecast() { Date = new DateTime(2020, 05, 13), TemperatureC = 18,
                                        Precipitation = 0.8},
                new WeatherForecast() { Date = new DateTime(2020, 05, 14), TemperatureC = 19,
                                        Precipitation = 0},
                new WeatherForecast() { Date = new DateTime(2020, 05, 15), TemperatureC = 14,
                                        Precipitation = 3.3},
                new WeatherForecast() { Date = new DateTime(2020, 05, 16), TemperatureC = 15,
                                        Precipitation = 1.7},
                new WeatherForecast() { Date = new DateTime(2020, 05, 17), TemperatureC = 18,
                                        Precipitation = 1},
                new WeatherForecast() { Date = new DateTime(2020, 05, 18), TemperatureC = 23,
                                        Precipitation = 0},
                new WeatherForecast() { Date = new DateTime(2020, 05, 19), TemperatureC = 21,
                                        Precipitation = 4.4},
                new WeatherForecast() { Date = new DateTime(2020, 05, 20), TemperatureC = 20,
                                        Precipitation = 8.5},
            };
        return forecasts;
    }
}
Assign the forecasts array to the Chart’s Data property.
<DxChart Data="@forecasts">
</DxChart>
Add Series
Do the following to create a bar and line series:
Add a DxChartBarSeries object to the chart. Set the ArgumentField and ValueField properties to the Date and Precipitation fields, respectively. Specify the Name property.
<DxChart Data="@forecasts">
    <DxChartBarSeries ArgumentField="@((WeatherForecast i) => i.Date)"
                      ValueField="@((WeatherForecast i) => i.Precipitation)"
                      Name="Precipitation">
    </DxChartBarSeries>
</DxChart>
Add a DxChartLineSeries object to the chart in the same way as the bar series. Assign the ValueField property to the TemperatureC field.
<DxChart Data="@forecasts">
    @*...*@
    <DxChartLineSeries ArgumentField="@((WeatherForecast i) => i.Date)"
                       ValueField="@((WeatherForecast i) => i.TemperatureC)"
                       Name="Temperature">
    </DxChartLineSeries>
</DxChart>
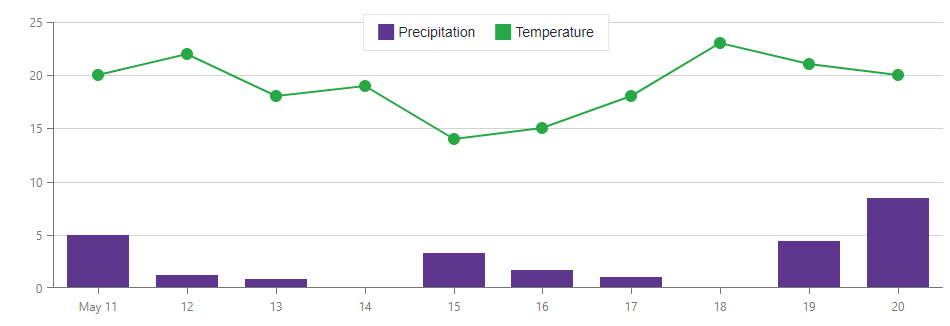
The Chart generates X and Y axes based on the type of argument and value data fields. The X-axis displays discrete values that correspond to dates. The Y-axes display numeric values (temperature and precipitation).
The Chart shows daily precipitation as rectangular bars and temperature as points joined by line segments. The legend lists all chart series.
Customize Axes
Follow the steps below to customize axis settings and make series use different Y axes.
Create a DxChartArgumentAxis object that implements the X axis. Add a DxChartAxisTitle class instance to the axis and specify the Text property.
<DxChart Data="@forecasts">
    <DxChartArgumentAxis>
        <DxChartAxisTitle Text="Date" />
    </DxChartArgumentAxis>
    @*...*@
</DxChart>
Create a DxChartAxisLabel object and set its Format property to ChartElementFormat.ShortDate.
<DxChartArgumentAxis>
    <DxChartAxisLabel Format='ChartElementFormat.ShortDate' />
</DxChartArgumentAxis>
Create two DxChartValueAxis objects with DxChartAxisTitle objects inside to generate Precipitation and Temperature Y-axes.
<DxChart Data="@forecasts">
    @*...*@
    <DxChartValueAxis>
        <DxChartAxisTitle Text="Precipitation, mm" />
    </DxChartValueAxis>
    <DxChartValueAxis>
        <DxChartAxisTitle Text="Temperature, C" />
    </DxChartValueAxis>
    @*...*@
</DxChart>
For the Temperature Y-axis, set the Alignment property to ChartAxisAlignment.Far and specify the Name property.
<DxChart Data="@forecasts">
    @*...*@
    <DxChartValueAxis Name="Temperature" Alignment="ChartAxisAlignment.Far">
        <DxChartAxisTitle Text="Temperature, C" />
    </DxChartValueAxis>
    @*...*@
</DxChart>
Set the line series’ Axis property to Temperature.
<DxChart Data="@forecasts">
    @*...*@
    <DxChartLineSeries ...
                       Axis="Temperature">
    </DxChartLineSeries>
</DxChart>
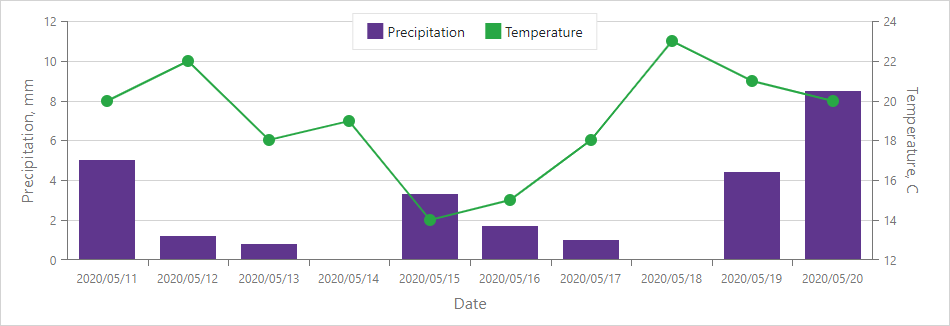
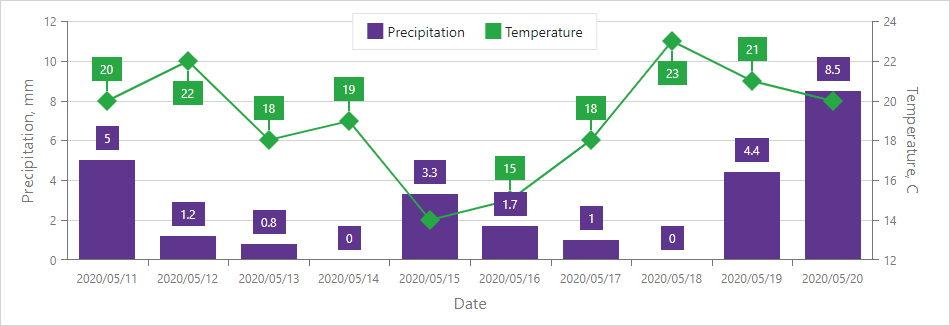
The line series now uses another Y-axis displayed on the right. The X-axis displays dates in short date format. All axes have titles.
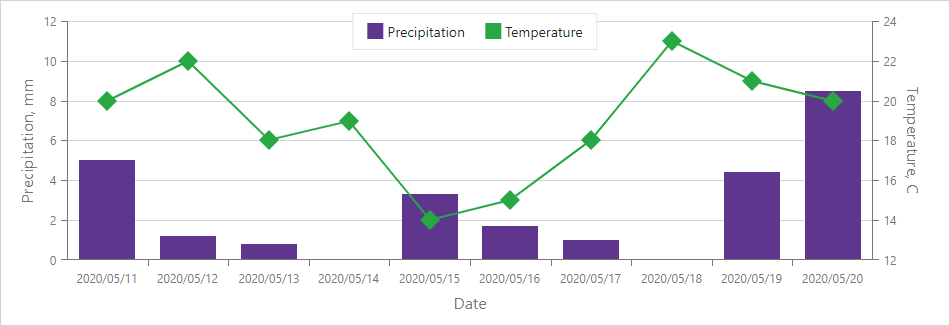
Customize Series Points
Create a DxChartSeriesPoint object inside the line series. Set the Symbol property to ChartPointSymbol.Polygon and the Size property to 20.
<DxChart Data="@forecasts">
    @*...*@
    <DxChartLineSeries ...>
       <DxChartSeriesPoint Symbol="ChartPointSymbol.Polygon" Size="20" />
    </DxChartLineSeries>
</DxChart>
Show Series Labels
Do the following to draw labels for series data points and avoid label overlap:
For the bar series, create a DxChartSeriesLabel object and set its Visible property to true.
<DxChartBarSeries ...>
    <DxChartSeriesLabel Visible="true" />
</DxChartBarSeries>
For the line series, create DxChartSeriesLabel and DxChartSeriesLabelConnector objects to display labels and lines between labels and series points.
<DxChartLineSeries ...>
    @*...*@
    <DxChartSeriesLabel Visible="true">
        <DxChartSeriesLabelConnector Visible="true" Width="2" />
    </DxChartSeriesLabel>
</DxChartLineSeries>
Set the Chart’s LabelOverlap property to ChartLabelOverlap.Hide to draw a point label if it does not overlap adjacent labels.
<DxChart Data="@forecasts" LabelOverlap="ChartLabelOverlap.Hide">
    @*...*@
</DxChart>
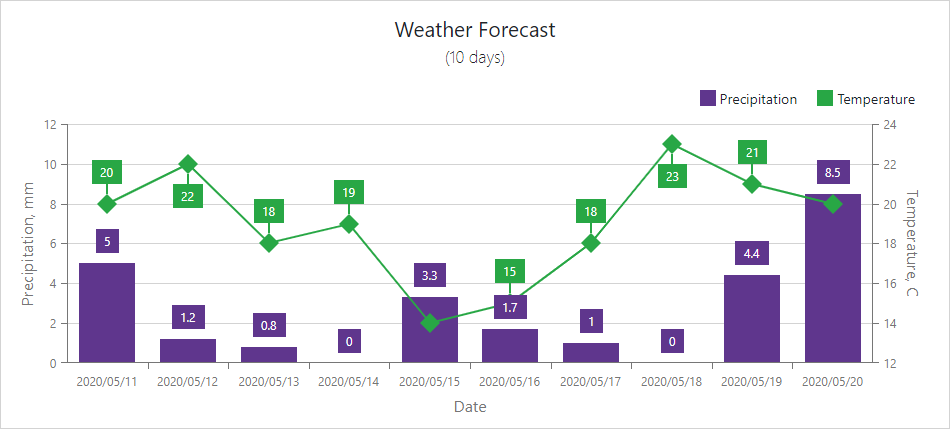
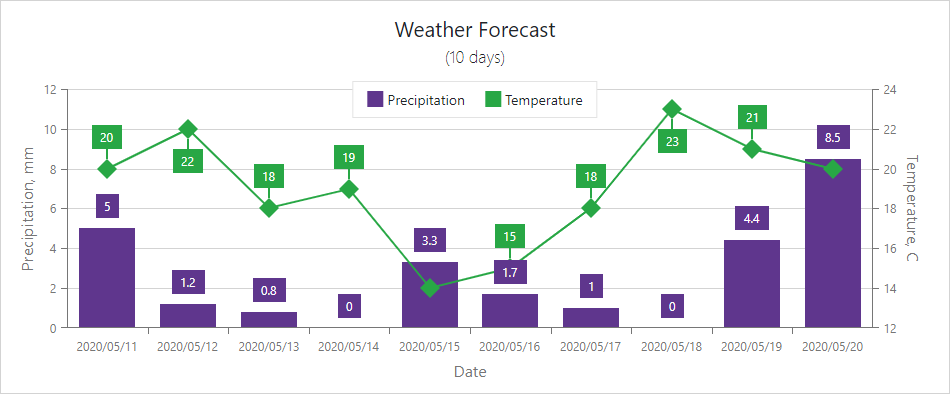
Add a Chart Title
Create DxChartTitle and DxChartSubTitle objects and specify their Text property.
<DxChart Data="@forecasts" LabelOverlap="ChartLabelOverlap.Hide">
    <DxChartTitle Text="Weather Forecast">
       <DxChartSubTitle Text="(10 days)" />
    </DxChartTitle>
     @*...*@
</DxChart>
Customize a Legend
Create a DxChartLegend object and specify its properties as shown below.
<DxChart Data="@forecasts" LabelOverlap="ChartLabelOverlap.Hide">
    @*...*@
    <DxChartLegend Orientation="Orientation.Horizontal"
                   HorizontalAlignment="HorizontalAlignment.Right"
                   Position="RelativePosition.Outside"/>
</DxChart>
A legend is now aligned to the right and displayed above the diagram area.
Complete Code
<DxChart Data="@forecasts" LabelOverlap="ChartLabelOverlap.Hide">
    <DxChartTitle Text="Weather Forecast">
        <DxChartSubTitle Text="(10 days)" />
    </DxChartTitle>
    <DxChartArgumentAxis>
        <DxChartAxisTitle Text="Date"/>
        <DxChartAxisLabel Format='ChartElementFormat.ShortDate' />
    </DxChartArgumentAxis>
    <DxChartValueAxis>
        <DxChartAxisTitle Text="Precipitation, mm"/>
    </DxChartValueAxis>
    <DxChartValueAxis Name="Temperature" Alignment="ChartAxisAlignment.Far">
        <DxChartAxisTitle Text="Temperature, C"/>
    </DxChartValueAxis>
    <DxChartBarSeries ArgumentField="@((WeatherForecast i) => i.Date)"
                      ValueField="@((WeatherForecast i) => i.Precipitation)"
                      Name="Precipitation">
        <DxChartSeriesLabel Visible="true" />
    </DxChartBarSeries>
    <DxChartLineSeries ArgumentField="@((WeatherForecast i) => i.Date)"
                       ValueField="@((WeatherForecast i) => i.TemperatureC)"
                       Name="Temperature"
                       Axis="Temperature">
        <DxChartSeriesPoint Symbol="ChartPointSymbol.Polygon" Size="20" />
        <DxChartSeriesLabel Visible="true">
            <DxChartSeriesLabelConnector Visible="true" Width="2" />
        </DxChartSeriesLabel>
    </DxChartLineSeries>
    <DxChartLegend Orientation="Orientation.Horizontal"
                   HorizontalAlignment="HorizontalAlignment.Right"
                   Position="RelativePosition.Outside"/>
</DxChart>

@code {
    private WeatherForecast[] forecasts;

    protected override void OnInitialized() {
        forecasts = GetForecast();
    }

    public class WeatherForecast {
        public DateTime Date { get; set; }
        public int TemperatureC { get; set; }
        public int TemperatureF => 32 + (int)(TemperatureC / 0.5556);
        public double Precipitation { get; set; }
    }

    public WeatherForecast[] GetForecast() {
        WeatherForecast[] forecasts = new WeatherForecast[] {
            new WeatherForecast() { Date = new DateTime(2020, 05, 11), TemperatureC = 20,
                                    Precipitation = 5},
            new WeatherForecast() { Date = new DateTime(2020, 05, 12), TemperatureC = 22,
                                    Precipitation = 1.2},
            new WeatherForecast() { Date = new DateTime(2020, 05, 13), TemperatureC = 18,
                                    Precipitation = 0.8},
            new WeatherForecast() { Date = new DateTime(2020, 05, 14), TemperatureC = 19,
                                    Precipitation = 0},
            new WeatherForecast() { Date = new DateTime(2020, 05, 15), TemperatureC = 14,
                                    Precipitation = 3.3},
            new WeatherForecast() { Date = new DateTime(2020, 05, 16), TemperatureC = 15,
                                    Precipitation = 1.7},
            new WeatherForecast() { Date = new DateTime(2020, 05, 17), TemperatureC = 18,
                                    Precipitation = 1},
            new WeatherForecast() { Date = new DateTime(2020, 05, 18), TemperatureC = 23,
                                    Precipitation = 0},
            new WeatherForecast() { Date = new DateTime(2020, 05, 19), TemperatureC = 21,
                                    Precipitation = 4.4},
            new WeatherForecast() { Date = new DateTime(2020, 05, 20), TemperatureC = 20,
                                    Precipitation = 8.5},
        };
        return forecasts;
    }
}