Series Types
- 2 minutes to read
The Bootstrap Polar Chart control supports the following series types.
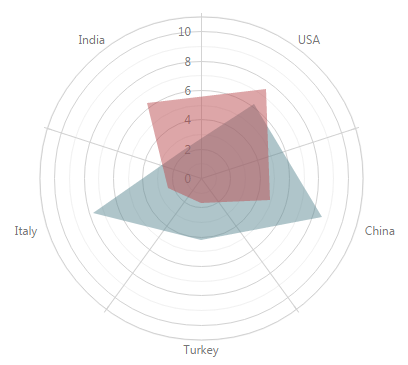
Area
The Area series type is useful when you need to emphasize a change in values. With this series type, data is displayed by a line that joins points, and the shaded area between this line and the zero value. This line is a border and is invisible by default.
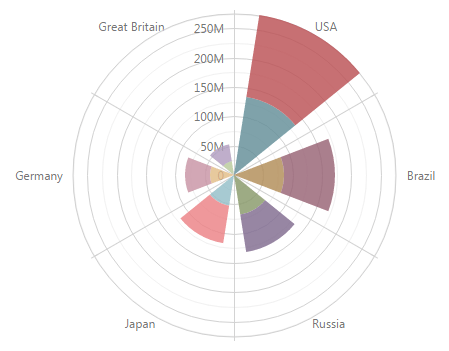
Bar
In the Bar series type, data is displayed as sets of rectangular bars with lengths proportional to the values that they represent. Often, bar series are used to compare values in different discrete categories such as months, countries, age, etc. When there are several bar series, bars for each argument are displayed side-by-side. If you need to show bars for each series stacked on each other, use the StackedBar series type.
Line
With the Line series type, data is displayed as points joined by a line. This series type is useful when you need to visualize a trend in data over intervals.
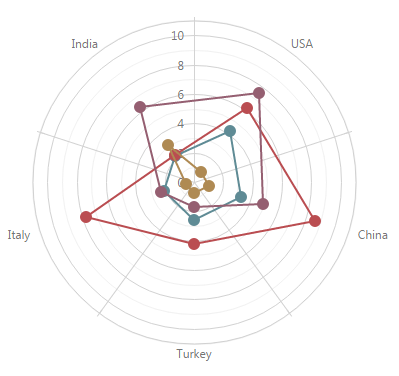
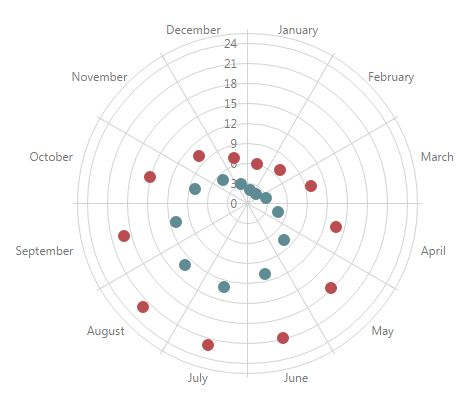
Scatter
With the Scatter series type, data is displayed as a collection of points. This series type is often used to display radar points.
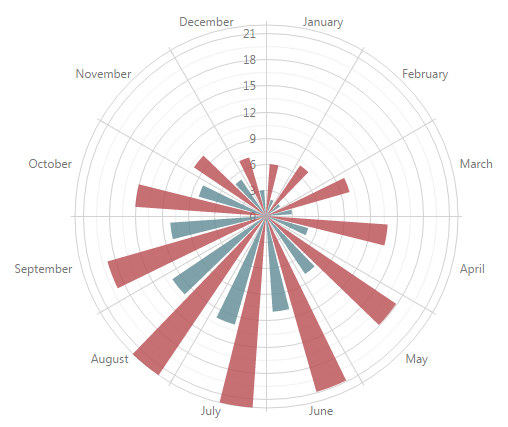
Stacked Bar
The StackedBar series type is used when there are several series that represent values for discrete categories. With this series type, data is displayed as triangular bars with lengths proportional to the values that they represent. Bars of each subsequent series are stacked on top of the bars of the previous series. The height of the resulting bar shows the combined result of a category.