Getting Started
- 4 minutes to read
This tutorial will help you get started using Bootstrap Charts in your web applications. You will learn how to add a chart to a page and perform all configurations required for it to work properly. Note that while this tutorial uses the Chart control as an example, you can use the same steps to configure the Polar Chart or Pie Chart
To start with this tutorial, create a new web application or web site and drop the BootstrapChart control on its page.
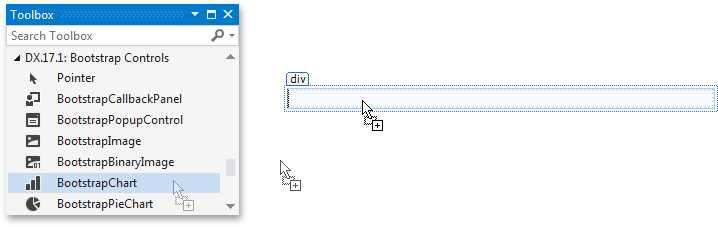
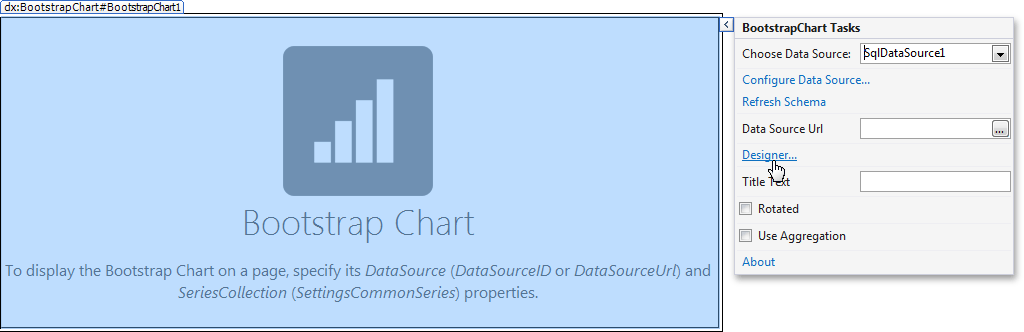
Assuming that you are not using one of the DevExpress project templates, the Chart control should appear on the design view as shown on the following image:
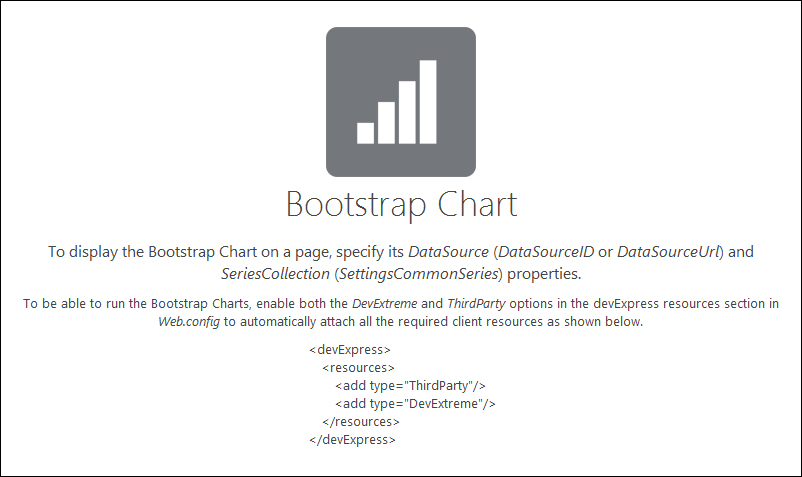
As you can see, the control displays hints informing you about configurations that you need to perform before the chart can be displayed on a page. Follow the steps described below to configure your chart.
- Provide the Required Client Libraries
- Bind to Data
- Create a Chart Series
- Additional Adjustments
- Get the Result
Provide the Required Client Libraries
Note
If you created your project using one of the DevExpress project templates, you can skip the steps described in this section, as the project is already configured to automatically attach all required client libraries.
The Bootstrap Charts depend on the functionality of the following client libraries.
- jquery-1.11.3.min.js
- cldr.min.js (0.4.3)
- cldr.event.min.js (0.4.3)
- cldr.supplemental.min.js (0.4.3)
- cldr.unresolved.js (0.4.3)
- globalize.js (1.0.1)
- globalize.message.min.js (1.0.1)
- globalize.number.min.js (1.0.1)
- globalize.currency.min.js (1.0.0)
- globalize.date.min.js (1.0.1)
- DevExtreme (17.1) dx.all.js
For a chart control to work properly, you either need to manually provide these libraries, or enable the control to load them automatically by specifying the following settings in the /devExpress/resources section in the Web.config file as shown below.
<devExpress>
    <resources>
        <add type="ThirdParty" />
        <add type="DevExtreme" />
    </resources>
</devExpress>
To learn more on how to manage static resources required by DevExpress controls using the /devExpress/resources section of the Web.config file, refer to the Embedding Third-Party Libraries document.
Bind to Data
Note
This section describes binding a chart to data provided by a data source control. To learn about other available data binding options, refer to the Binding to Data document.
Use the following steps to bind your chart to data.
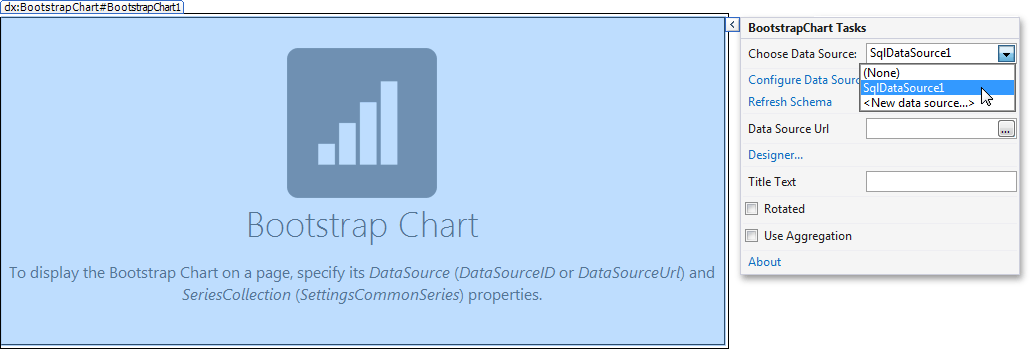
- Add one of ASP.NET data source controls (such as SqlDataSource) to the page and connect it to a data base.
Click the Chart control’s smart tag. In the invoked actions list, expand the Choose Data Source drop-down list and select your data source.
Create a Chart Series
Now that your chart is bound to a data source, you need to create and configure a chart series to tell the Chart control how you want it to visualize data items. The steps below describe how to create a chart series using the BootstrapChart Designer shipped with the Bootstrap Charts suite.
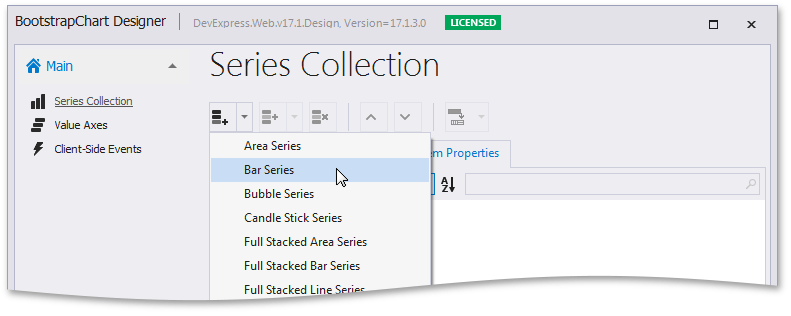
Click the Chart control’s smart tag and select the Designer
Go to the Series Collection page of the invoked BootstrapChart Designer. Expand the drop-down menu for the Add button and select the Bar series type.
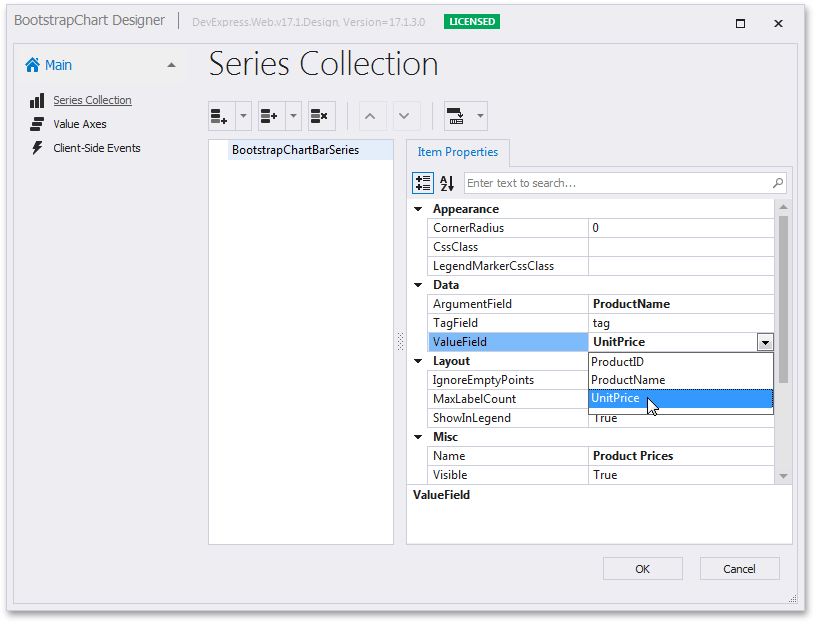
Specify the required series settings on the Item Properties panel. For a bar series, you need to specify the BootstrapChartCommonSeriesBase.ArgumentField and BootstrapChartSeries.ValueField properties to define which data fields should provide arguments and values for series data points. Additionally, specify the BootstrapChartCommonSeriesBase.Name property to define what the series should be called in the chart legend. Note that the required settings may differ between series types.
Note
If a setting is common to all series types (for example, ArgumentField), you can set it globally for all chart series using the chart’s SettingsCommonSeries property.
To see chart series of all available types in action, view the following demos online:
Additional Adjustments
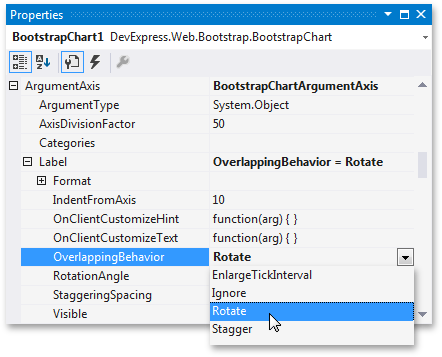
You can fine-tune the chart presentation and behavior in numerous ways using properties exposed by the chart control and its functional elements. For example, in this tutorial, labels displayed by the chart’s argument axis take too much horizontal space so they may overlap when the chart is viewed with a small screen resolution. You can resolve this issue by specifying a suitable overlap resolving algorithm using the BootstrapChartAxisLabelSettings.OverlappingBehavior option available through the BootstrapChart.ArgumentAxis.Label.OverlappingBehavior property.
Get the Result
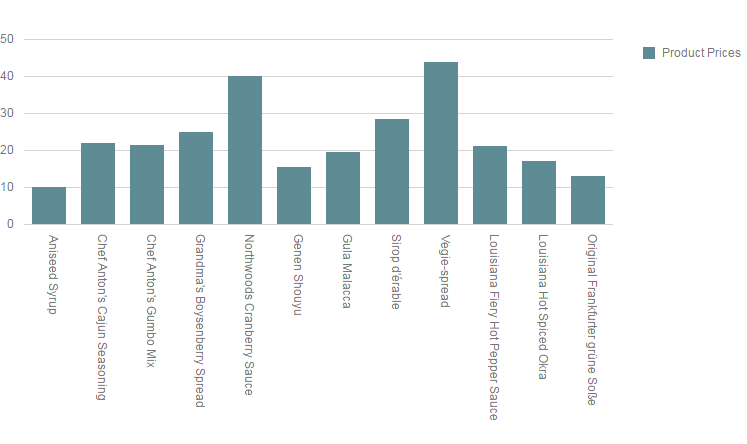
After the essential settings are specified, the Chart control will appear on the design view as shown below.
Run the solution to view the result.