Overview
- 2 minutes to read
The crosshair cursor allows you to track series point coordinates, which adds interactivity to a chart. It is also used for data analysis, when you need to compare different graphs.
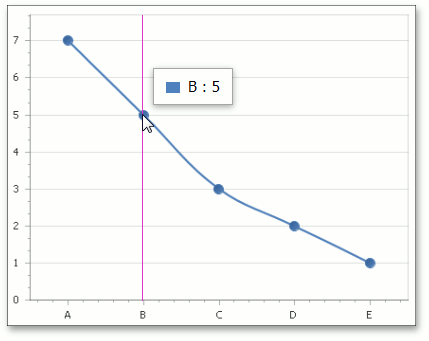
The crosshair cursor includes a pair of intersecting horizontal and vertical lines (the value line and the argument line) with corresponding axis labels (value labels and argument labels) at the end of the lines. Initially, only the crosshair argument line is visible.
See the following topic to learn how to customize the crosshair cursor and its elements: Crosshair Cursor Customization.
The cursor also contains a label (the crosshair label), which is positioned at the intersection of the lines. This label is also visible and shows the current series point argument and value.
When your chart contains two or more series, the crosshair cursor label has the following appearance:
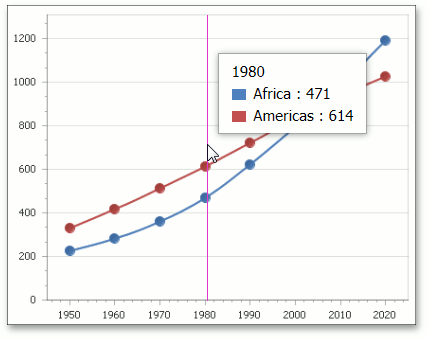
As you can see, each crosshair label contains a group header that helps to operate with numerous data. If you wish to hide the group header, set the CrosshairOptions.ShowGroupHeaders property to false.
Note
If a series name is not displayed on a crosshair label, you need to specify it using the Series.Name property.
The crosshair cursor is initially enabled. This means that you do not need to write any code to add it to a chart. If you wish to deactivate the crosshair cursor, you can do one of the following:
- Use the WebChartControl.CrosshairEnabled property to disable/enable a crosshair cursor at the chart control level;
- Use the SeriesBase.CrosshairEnabled property to disable/enable a crosshair cursor for a specific series.
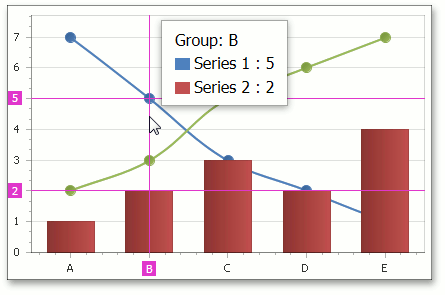
The following image illustrates the second option: the crosshair cursor is disabled for Spline series only.
Note
In the image above, group headers of the crosshair cursor were formatted using the CrosshairOptions.GroupHeaderPattern property set to the “Group: {A}” value. See the following help topic to learn more: Crosshair Cursor Customization.
Alternatively, you can use tooltips to interact with data. See the following help topic to learn more: Tooltips.