Calculating Summaries
- 5 minutes to read
The chart control provides built-in and custom summary functions, which can be calculated for data-bound series on the series points values. This document describes summary functions and ways of applying them.
In addition to summary functions, the chart control can automatically aggregate data depending on its size. For more information, refer to Data Aggregation.
The document consists of the following sections.
Built-in Summary Functions
The chart control provides the following built-in summary functions:
- minimum (“MIN”),
- maximum (“MAX”),
- sum (“SUM”),
- average (“AVERAGE”),
- count (“COUNT”).
Important
Automatic summary functions can be calculated only for those Series Views, which operate with data points with only 1 value for each. If series’ data points have 2 or more values (e.g., Range,Gantt, Financial and Bubble series views), you should use Custom Summary Functions instead.
The summary function can’t be calculated when the ScaleOptionsBase.ScaleMode is set to Continuous.
The table below demonstrates a chart that utilizes a Bar series, with a summary and no summary applied to its data.
| Summary function is not applied | Summary function is applied |
|---|---|
 |
 |
Note that the chart control should be aware of the specified measure unit before you apply a summary function to series data. To illustrate this behavior, consider the chart control bound to the following data table.
| SeriesPoint | Argument | Value |
|---|---|---|
| [0] | 1 | 5 |
| [1] | 1 | 10 |
| [2] | 2 | 20 |
| [3] | 2 | 40 |
| [4] | 3 | 20 |
| [5] | 3 | 65 |
| [6] | 5 | 15 |
| [7] | 6 | 25 |
| [8] | 7 | 50 |
| [9] | 8 | 25 |
| [10] | 9 | 65 |
| [11] | 10 | 25 |
| [12] | 10 | 15 |
| [13] | 20 | 120 |
| [14] | 20 | 120 |
The table below shows how the SUM summary function depends on the measure unit.
| MeasureUnit = Ones, SummaryFunction = SUM | MeasureUnit = Tens, SummaryFunction = SUM |
|---|---|
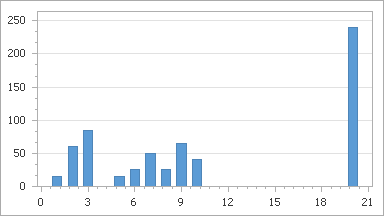 |
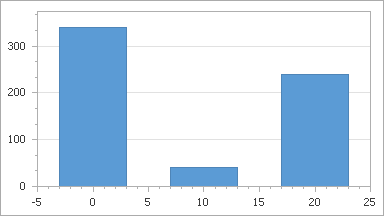 |
In the charts above, the measure unit is specified manually in the manual scale mode (the ScaleOptionsBase.ScaleMode property is set to Manual) using the NumericScaleOptions.MeasureUnit (DateTimeScaleOptions.MeasureUnit ) property.
If you need the chart control to calculate a measure unit and apply it to the X-axis automatically depending on the chart data, select the automatic scale mode (the ScaleOptionsBase.ScaleMode property is set to Automatic). For more information, refer to Data Aggregation.
Note
If you specify the summary function, the aggregate function (ScaleGridOptionsBase.AggregateFunction) can’t be applied to data.
In addition to the built-in summary functions, you can create a custom one to calculate a summary value in any way you wish. For more details, see the Custom Summary Functions section.
Example
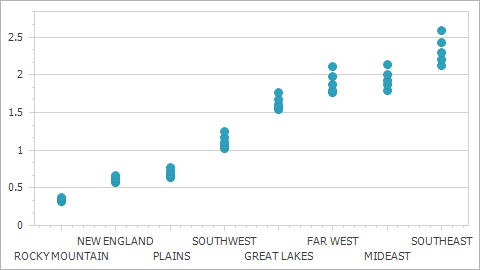
Consider the chart control bound to a data source. For instance, let’s take a chart from Lesson 4 (see the “Create Data Objects and Bind a ChartControl” section), bound to the GSP database.
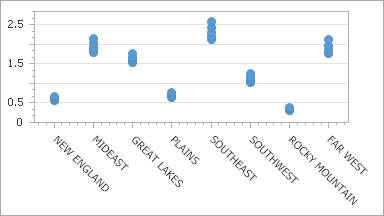
Add a Point series to the chart. Then, set the SeriesBase.ArgumentDataMember property to the Region data field, and SeriesBase.ValueDataMembers property to GSP.
This initial chart is shown below.
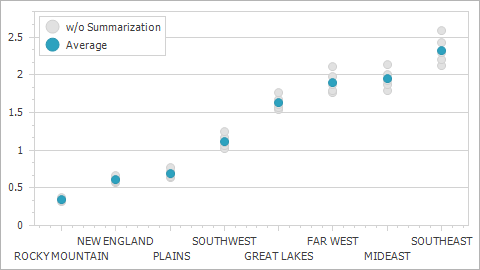
To calculate the SUM function for the GSP data field, do the following.
- Select the required series and in the Properties window, locate its SeriesBase.SummaryFunction property.
Click the ellipsis button to invoke the Summary Function dialog.
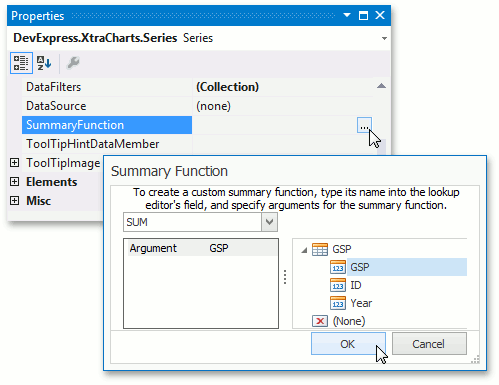
In this dialog, choose the required summary function and the data field to be summarized.
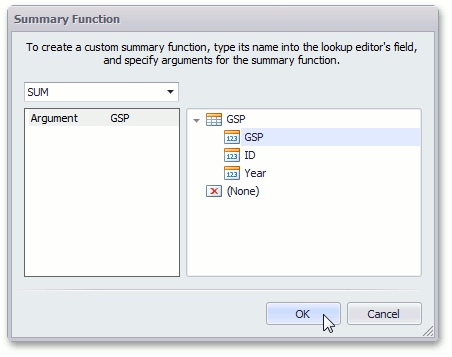
- To apply the changes and quit the dialog, click OK.
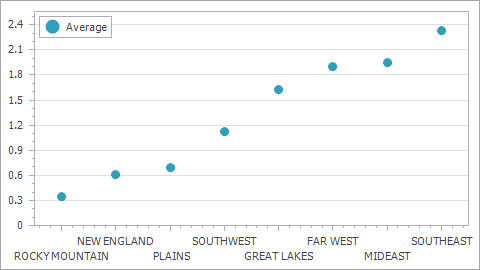
The result is shown in the image below.
The following code snippet illustrates how to do the same at runtime.
Custom Summary Functions
To create a custom summary function, register it by calling the WebChartControl.RegisterSummaryFunction method with the specified parameters (name, displayName, resultScaleType, resultDimensions, argumentDescriptions, function).
The code below illustrates how this can be done in WinForms.
using System;
using System.Windows.Forms;
using DevExpress.XtraCharts;
// ...

namespace WindowsApplication1 {
    public partial class Form1 : Form {

        // Declare the Product summary function.
        private static SeriesPoint[] CalcProductValue(Series series, object argument,
        string[] functionArguments, DataSourceValues[] values) {

            // Create an array of the resulting series points.
            SeriesPoint[] points = new SeriesPoint[values.Length];

            // Calculate the resulting series points as Price * Count.
            for (int i = 0; i < values.Length; i++)
                points[i] = new SeriesPoint(argument,
                    Convert.ToDouble(values[i][functionArguments[0]]) *
                    Convert.ToDouble(values[i][functionArguments[1]]));

            // Return the result.
            return points;
        }

        public Form1() {
            InitializeComponent();

            // Create argument descriptions for the summary function.
            SummaryFunctionArgumentDescription argument1Description =
                new SummaryFunctionArgumentDescription("Price", ScaleType.Numerical);
            SummaryFunctionArgumentDescription argument2Description =
                new SummaryFunctionArgumentDescription("Count", ScaleType.Numerical);

            // Register the summary function in a chart.
            chartControl1.RegisterSummaryFunction("PRODUCT", "PRODUCT", 1,
                new SummaryFunctionArgumentDescription[] {
                    argument1Description, argument2Description },
                CalcProductValue);

            // Provide a datasource for the chart.
            chartControl1.DataSource = nwindDataSet.Products;
        }

        private void Form1_Load(object sender, EventArgs e) {
            // This line of code loads data into the 'nwindDataSet.Products' table.
            this.productsTableAdapter.Fill(this.nwindDataSet.Products);

        }
    }
}
Tip
A complete sample project is available in the DevExpress Code Examples database at http://www.devexpress.com/example=E368.