Filtering Data
- 2 minutes to read
This document describes how to filter a chart’s data at the level of the chart control (as opposed to the filtering at the data source’s level).
You can apply a filtering criterion to a chart’s underlying data, so that only the data satisfying this criterion will be shown in the chart. For this, the SeriesBase.DataFilters property is provided, which allows you to perform complex data filtering, based on as many criteria as required.
Note
Note that when dealing with large data sources, filtering their data at the chart control level may not be as efficient as filtering at the data source level. So, if you need to sort data from a large data source, it’s recommended to do this using SQL, at the level of your data source. To learn more on this, refer to MSDN.
After you bing your chart to a data source, and define the SeriesBase.ArgumentDataMember and SeriesBase.ValueDataMembers properties of a series, you can define a data column to be used as a filtering criteria, a logical condition, and a value upon which this condition should be applied to that data field.
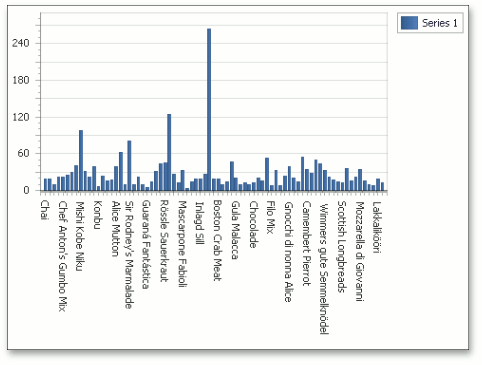
For example, we’ll use the chart created in the Lesson 3 - Bind Chart Series to Data, with the series view type set to the Bar. The initial, unfiltered chart is shown in the following image.
Now, let’s only show data for 4 points.
To limit the number of data points in the series, click the ellipsis button for the SeriesBase.DataFilters property.
In the invoked Data Filter Collection Editor, click Add, and for the created filtering criterion, set its DataFilter.ColumnName to CategoryID and DataFilter.Value to 4. And leave the DataFilter.Condition property set to its default value (Equal).
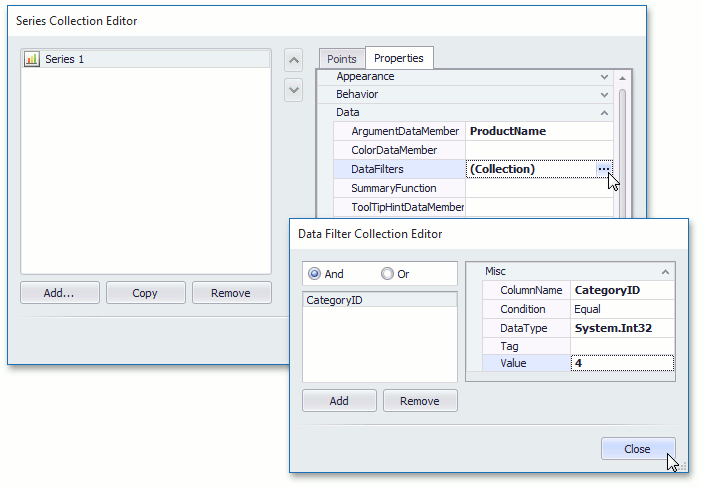
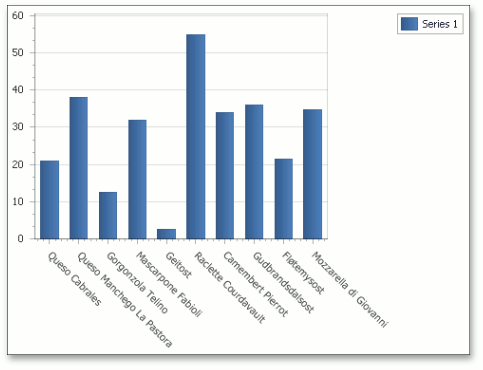
To apply the changes and quit the dialog, click Close. The result is shown in the following image.
To learn how a filtering expression can be applied to a chart’s data at runtime, refer to How to: Filter Data.
With the date-time scale type, it’s possible to exclude holidays and weekends from an axis scale. To learn more on this, refer to Data Aggregation.