Data Aggregation
- 4 minutes to read
This document explains the concept of data aggregation, and how to customize this feature for the date-time and numeric data.
The document consists of the following sections.
Overview
Data aggregation is useful when your charts display a very large amount of data (e.g., thousands or even millions of data points), and it is necessary to have a quick aggregated view of this data.
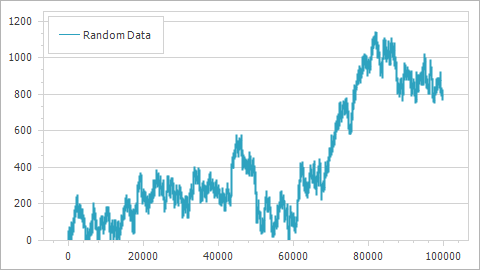
The image below shows a chart with non-aggregated data.
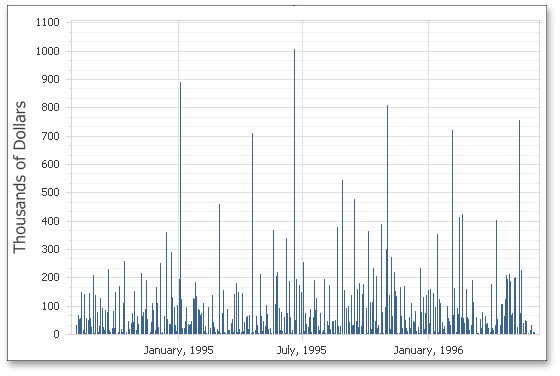
When the data aggregation is enabled in the chart control, the chart will split the entire X-axis into intervals (according to the measure unit value) and automatically aggregate data for each interval.
Note
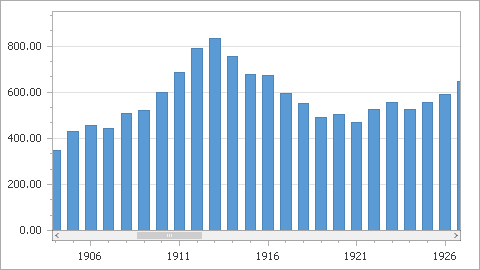
Data aggregation is available for the arguments axis (X-axis) only, and neither the value axis (Y-axis) nor the secondary axes have this property.
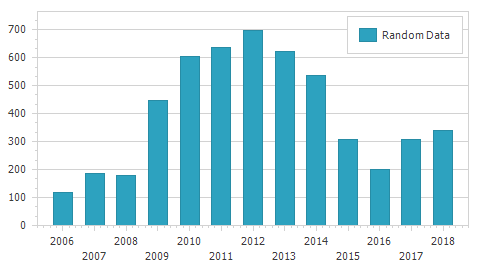
The following image shows chart data aggregated by year.
The sections below detail the specifics of using the aggregation feature for date-time and numeric data.
Date-time Data
For date-time data on the X-axis, automatic data aggregation is enabled by default, and the date-time ScaleOptionsBase.ScaleMode is Manual. In this mode, the DateTimeScaleOptions.GridAlignment and DateTimeScaleOptions.MeasureUnit properties are available. These properties allow you to define the output format of date-time values shown by the axis labels. The following image illustrates these options.
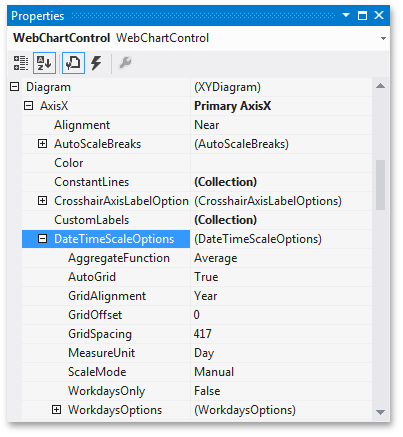
For instance, you can use the DateTimeScaleOptions.MeasureUnit property to determine the detail level for date-time values. Predefined measure units for date-time scales are Millisecond, Second, Minute, Hour, Day, Week, Month, Quarter and Year.
| DateTimeScaleOptions.MeasureUnit = Day (default option) | DateTimeScaleOptions.MeasureUnit = Month |
|---|---|
 |
 |
If the ScaleOptionsBase.ScaleMode property is set to Automatic, the Chart control automatically defines the most optimal unit of measure for an axis based on the input data. In this case, the DateTimeScaleOptions.GridAlignment and DateTimeScaleOptions.MeasureUnit properties become unavailable.
Data for each interval on the X-axis is aggregated using the function specified by the ScaleGridOptionsBase.AggregateFunction property (available both in the Automatic and Manual scale modes). Although by default, aggregate function is set to Average, it can be changed to Minimum, Maximum, Sum, etc.
The table below shows data aggregation in the Automatic scale mode using the Minimum and Sum functions.
| Aggregate Function = Minimum |
|---|
 |
| Aggregate Function = Sum |
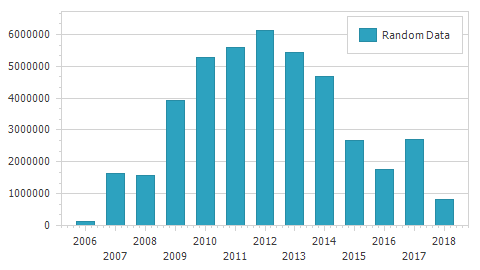 |
In automatic date-time scale mode, the DateTimeOptions.Format and DateTimeOptions.FormatString properties are calculated automatically. Their values can be obtained in the WebChartControl.AxisScaleChanged event handler.
This event also allows you to obtain the values calculated for an axis grid alignment unit and a measure unit, and access other properties of the axis. For a code example, refer to How to: Obtain Values Calculated for Automatic Axis Date-Time Scale Modes.
If you wish to disable aggregation, do one of the following:
- In the Manual or Automatic scale mode, set the AggregateFunction property to None.
- Set the ScaleOptionsBase.ScaleMode property to Continuous. In this mode an axis scale is not divided into intervals, and therefore aggregation cannot be applied to chart data.
Note
Only Continuous mode is available for a Gantt series because their values intrinsically have the date-time scale type, when only the numeric value scale type is required.
Numeric Data
Automatic data aggregation is disabled for the numeric scale type because the scale mode is set to Continuous, by default.
To enable this feature, you need to change the current scale mode either to Manual or Automatic.
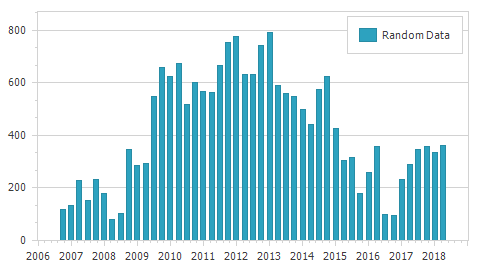
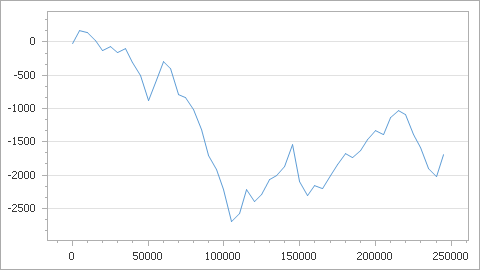
The following image shows data aggregation in Automatic scale mode using the default Average function.
If the Average aggregate function does not meet your business requirements, you can apply another function using the ScaleGridOptionsBase.AggregateFunction property (also available in the Manual scale mode).
In the Manual scale mode the predefined measure units are Ones, Tens, Hundreds, Thousands, Millions, Billions. In addition, you can specify a custom measure unit using the NumericScaleOptions.CustomMeasureUnit property when the NumericScaleOptions.MeasureUnit property is set to Custom.
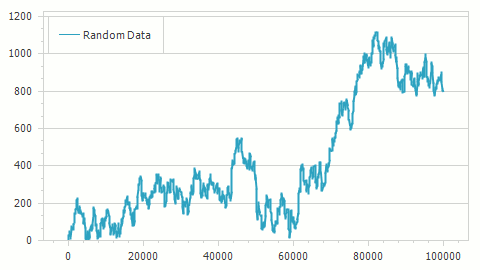
The following table shows data aggregation of a random function for a measure unit set to Thousands and Hundreds.
| NumericScaleOptions.MeasureUnit = Thousands | NumericScaleOptions.MeasureUnit = Hundreds |
|---|---|
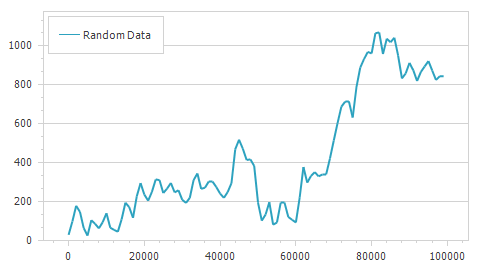 |
 |