Lesson 3 - Bind Chart Series to Data
- 4 minutes to read
This tutorial demonstrates how to bind a Web chart to an external data source, manually add a series to the chart, and adjust its data bindings - which allows you to provide an individual data source for each series.
Bind a chart’s series to data manually via the steps below.
- Step 1. Create a Web Chart and Bind it to Data
- Step 2. Specify a Series Data Source
- Step 3. Populate the Chart with Data at Design Time
- Step 4. Customize the Chart
- Result
Step 1. Create a Web Chart and Bind it to Data
- Create a new ASP.NET Web Application (Visual Studio 2012, 2013, 2015 or 2017) or open an existing one.
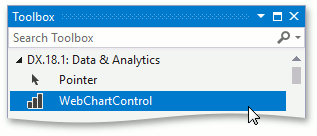
From the DX.18.2: Data & Analytics toolbox tab, drop the WebChartControl onto the form.
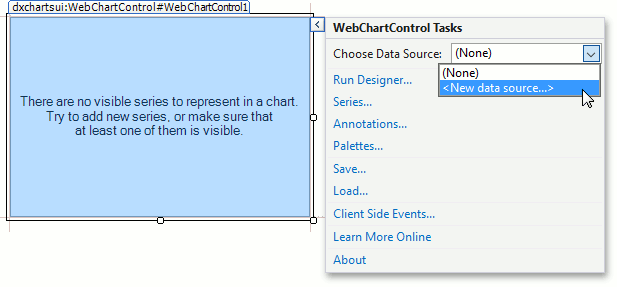
Click the chart’s smart tag to invoke its Tasks list. Then, open the drop-down list for the Choose Data Source item and click <New data source…>.
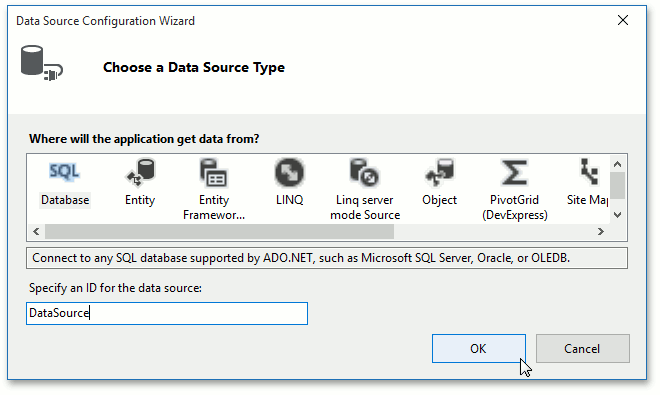
This will invoke the Data Source Configuration Wizard. Choose SQL Database and click OK.
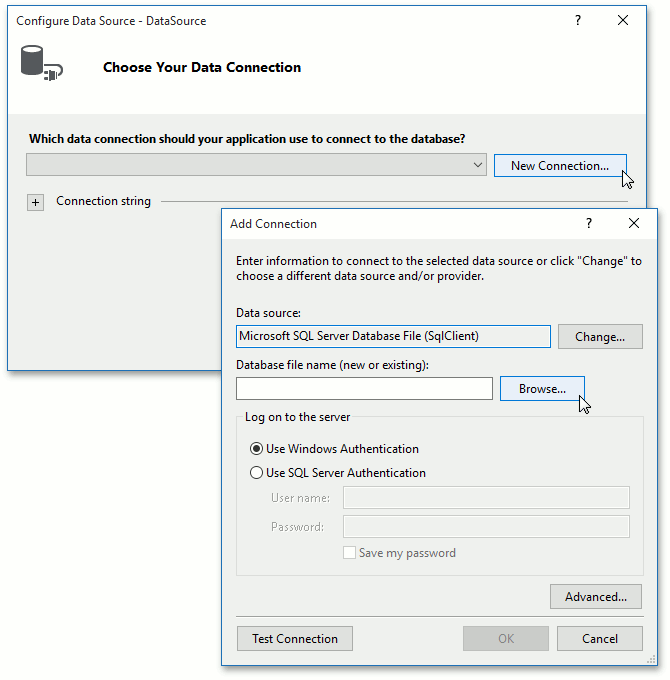
On the next page, click New Connection…. In the invoked Add Connection dialog, do the following.
- Check to make sure that the data source type is set to Microsoft SQL Server Database File (SqlClient).
Click the Browse button opposite the Database file name text box.
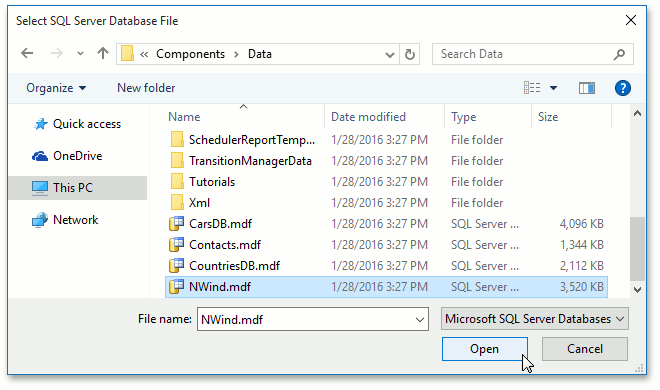
In the invoked Select SQL Server Database File dialog, select the NWind.mdf file that ships with the DevExpress Demos.
Note
By default, this file is stored in the C:\Users\Public\Documents\DevExpress Demos 18.2\Components\Data\NWind.mdf path.
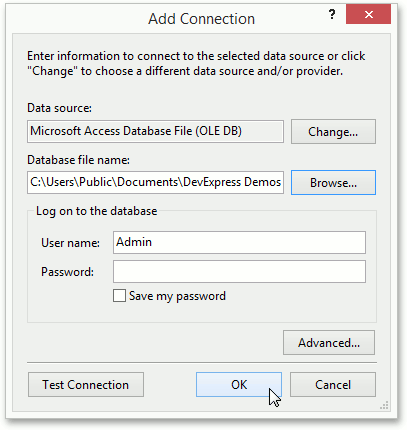
Click OK to close the dialog.
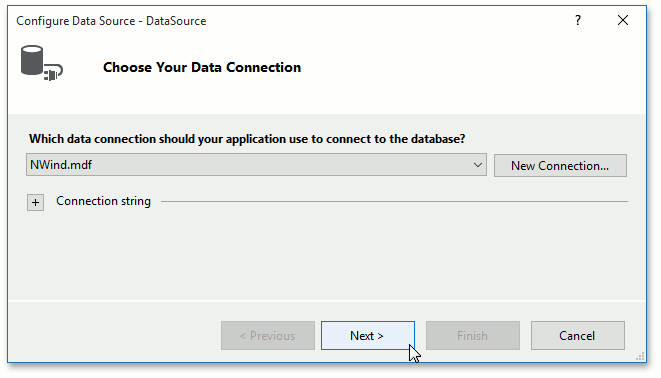
To proceed, click Next>.
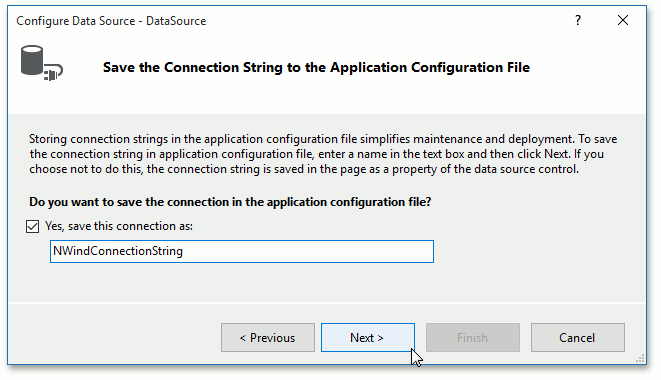
On the Save the Connection String to the Application Configuration File window, click Next>.
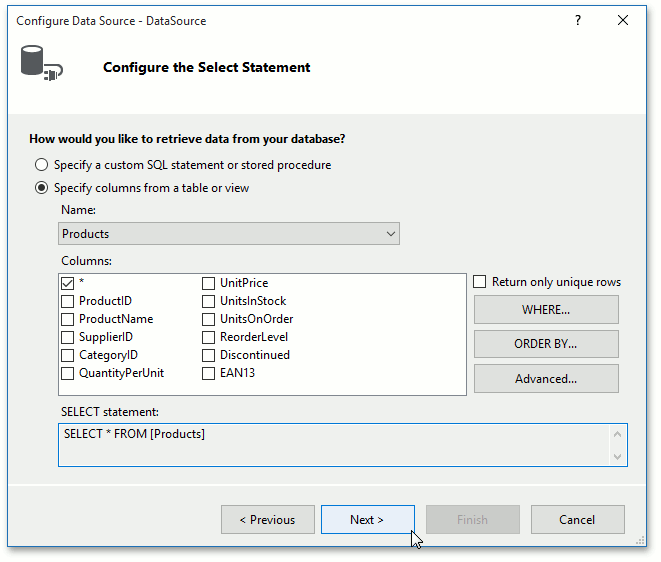
On the next page, choose the Products table from the database and click Next>.
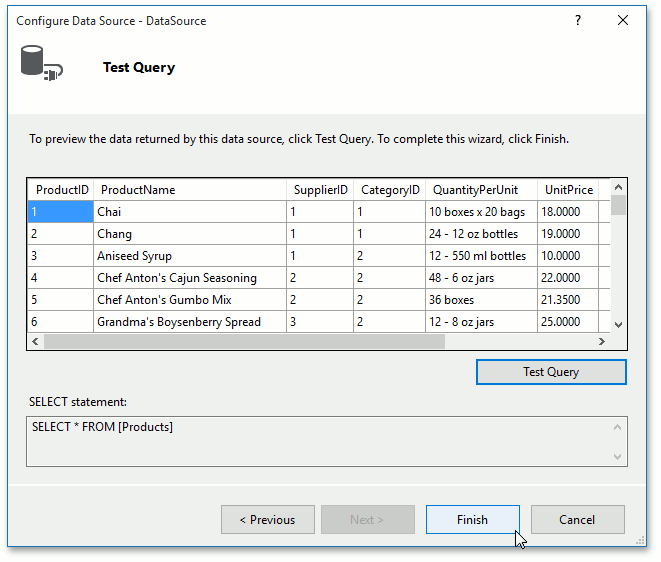
On the last page, you can test the database connection by clicking Test Query.
Click Finish to complete data source creation.
The DataSource object is now assigned to the chart. The next steps specify which data fields should be used to provide data for the chart’s series.
Step 2. Specify a Series Data Source
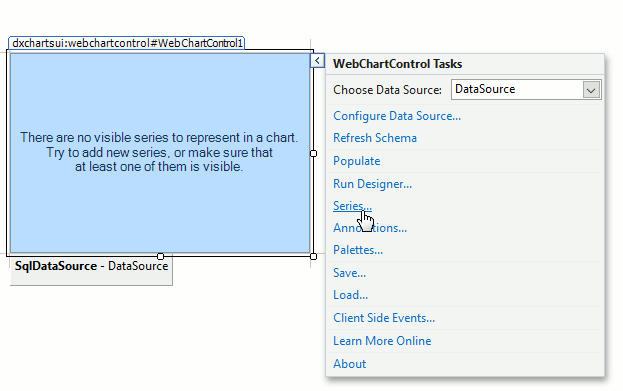
Next, add a series to the chart. To do this, click the chart’s smart tag, and in the invoked Tasks list, choose Series….
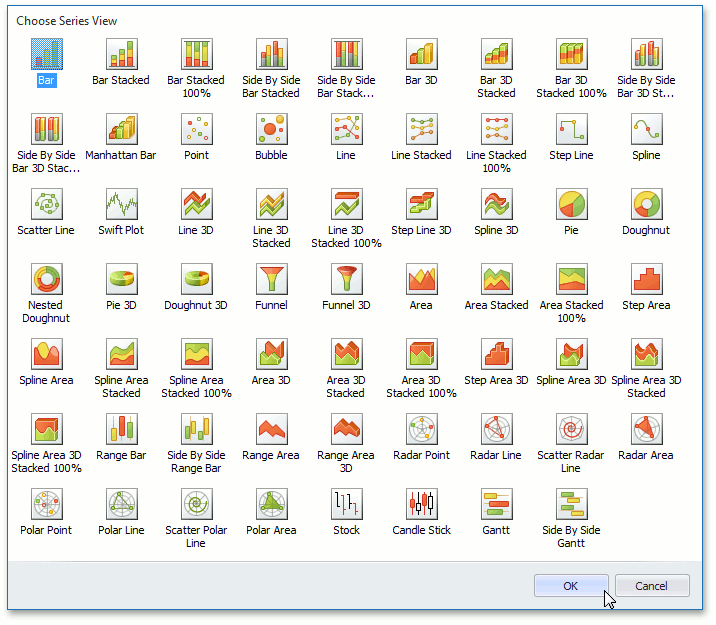
In the invoked Series Collection Editor, click Add… and select the Bar view.
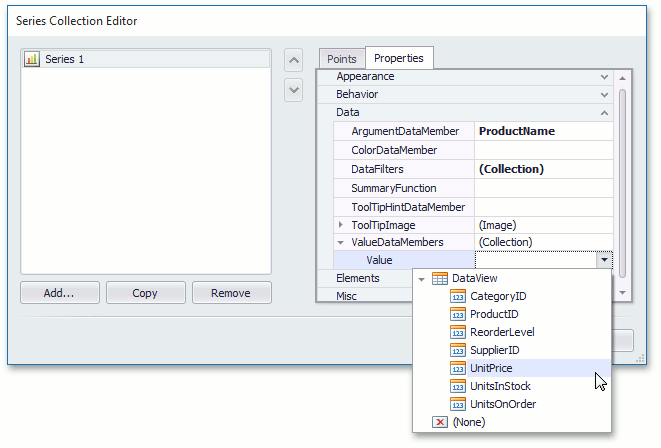
Now, switch to the Properties tab on the right of the editor’s window and make the following assignments for the Series1 properties.
- Set the SeriesBase.ArgumentDataMember property to the ProductName data field.
- Set the SeriesBase.ValueDataMembers property’s Value to UnitPrice.
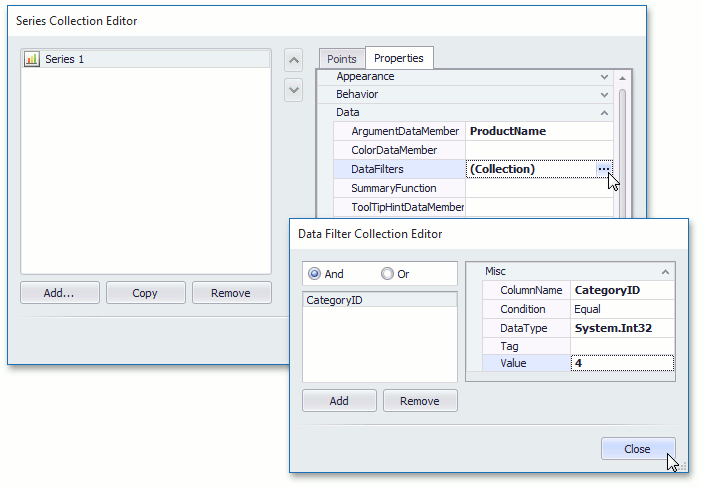
To filter displayed data points in the series, click the ellipsis button opposite the SeriesBase.DataFilters property. In the invoked Data Filter Collection Editor, click Add, and for the created filtering criterion, set its DataFilter.ColumnName to CategoryID and DataFilter.Value to 4. Leave the DataFilter.Condition property set to its default value (Equal).
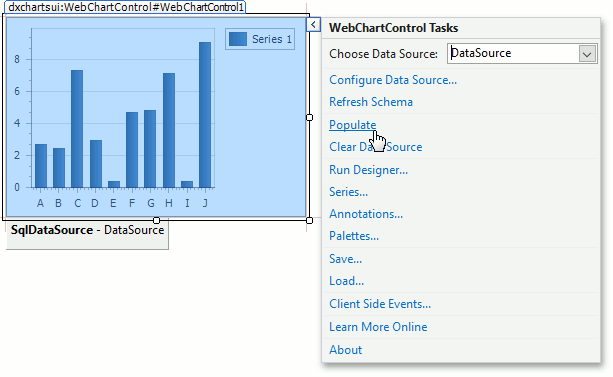
Step 3. Populate the Chart with Data at Design Time
To see how the chart will look at design time, click its smart tag, and in the invoked Tasks list, click Populate. This will redraw the chart using the provided data.
Step 4. Customize the Chart
Now that data has been provided to the chart, follow the steps below to improve its appearance.
- Increase the size of the chart via the WebChartControl.Width property to 640px and WebChartControl.Height to 360px.
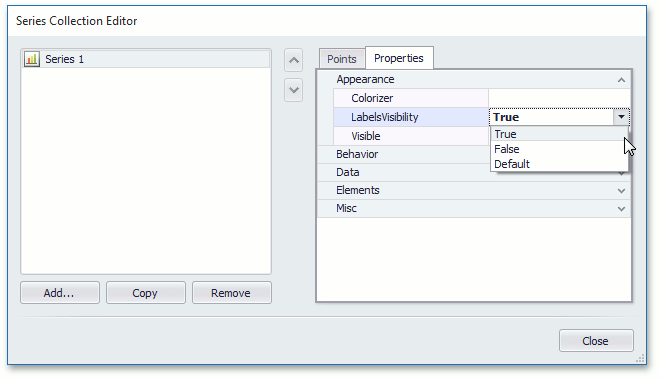
For the created series, it is possible to show series labels via the SeriesBase.LabelsVisibility property.
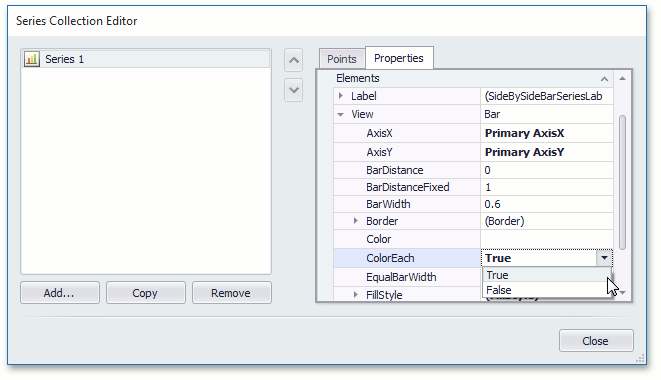
You can also color each Bar individually. To achieve this, invoke the Series Collection Editor and switch to the Properties tab of the dialog. Then, expand the SeriesBase.View property, and enable the SeriesViewColorEachSupportBase.ColorEach property. Each data point is now represented in the chart’s legend by a separate item, which displays an argument - value pair of points.
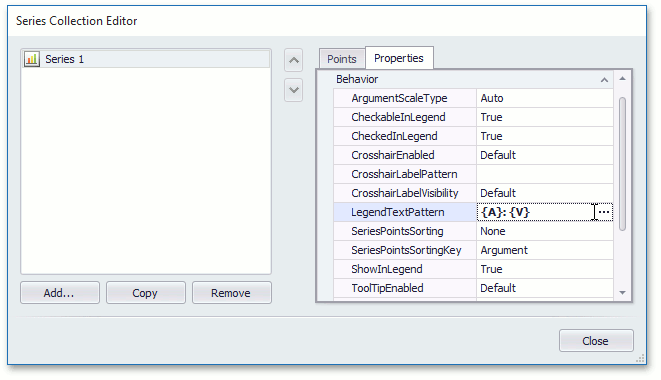
Modify legend content and location by setting the series’ SeriesBase.LegendTextPattern property to “{A}: {V}” - to increase chart readability.
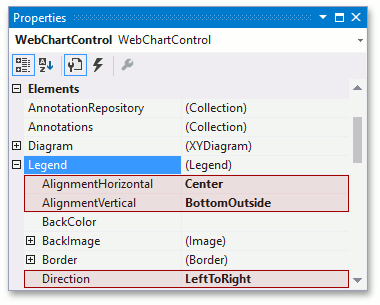
For better legend positioning, in the Properties window, expand the WebChartControl.Legend property, and set its Legend.Direction to LeftToRight, Legend.AlignmentHorizontal to Center, and Legend.AlignmentVertical to BottomOutside.
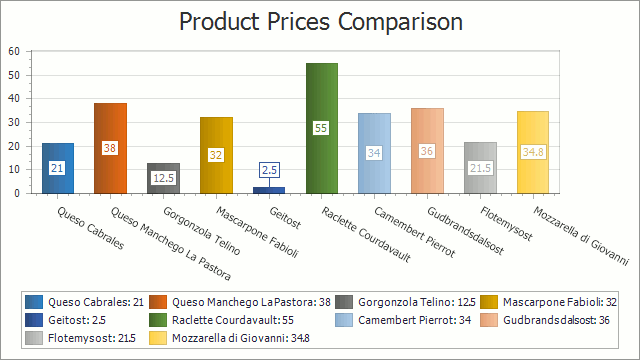
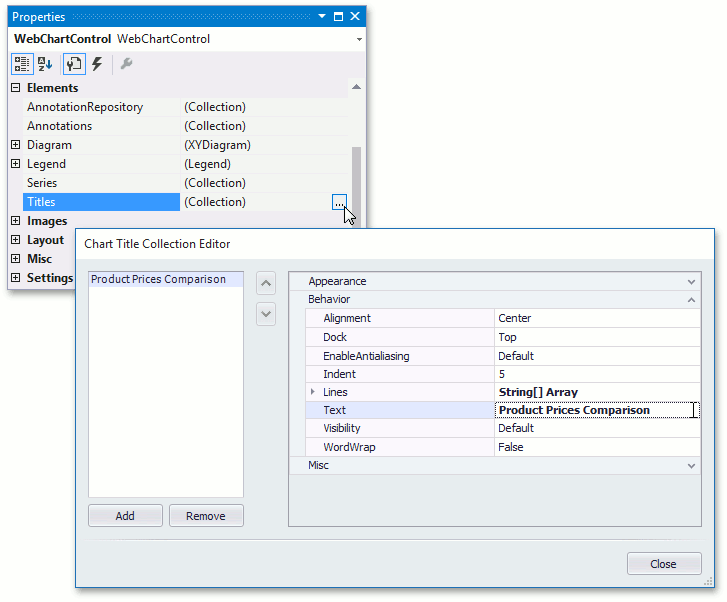
To create a title for your chart, click the ellipsis button for the WebChartControl.Titles property in the Properties window. Then, in the invoked collection editor, click Add, and for the newly created title, set its Title.Text to “Product Prices Comparison”.
Result
The result is shown in the following image.